Data Cleaning: Step by Step Guide with Examples
By Dr. Zubair Khalid, DVM, MS, PhD ·
Data cleaning is the process of reviewing and editing a dataset to correct errors, remove duplicates, and make the formatting and content fit your research question [1]. It covers missing values, duplicate records, inconsistent formats, impossible values, and outliers [2][3]. This guide walks through a repeatable workflow, then applies it to a small messy sales dataset so you can see every number change.
Quick Answer
- Load the raw data and record the starting row count before you change anything.
- Screen for problems in this order: duplicates, inconsistent formats, missing values, impossible values, outliers [4].
- Fix duplicates first, because removing rows changes every count and statistic that follows.
- Fill missing numeric values with a defensible summary such as the median, and document the choice [5].
- Flag outliers instead of deleting them, since they often carry real information about the process [6].
Before You Start
Data cleaning is not an obvious or objectively neutral process [1]. Every decision you make, from which duplicate to keep to how you fill a blank price, changes your models and results. Keep a log of each decision and the reason behind it.
Two habits prevent most rework. First, work on a copy and keep the raw file untouched. Second, define your rules before you look at the results, because it is easy to justify any edit once you know which answer you prefer [4]. A short written rule such as "duplicate order IDs keep the first occurrence" removes the guesswork later.
It also helps to know where the data came from. A curated repository dataset usually needs less work than thousands of rows typed into an online form by hand [1]. If you are still assembling the file, the steps in what data preprocessing involves overlap heavily with what follows here.
Step by Step
- Profile the data. Count rows and columns, list data types, and count blanks per column. This tells you which problems exist and how big they are.
- Standardize formats. Convert dates to one type, trim whitespace from text, and make units consistent across the dataset [1]. Mixed date formats are one of the most common sources of silent errors.
- Remove duplicates. Decide what counts as a duplicate. Exact row matches are safe to drop. Partial matches based on a key column such as an ID need a rule about which record to keep [5].
- Handle missing values. Options include removing rows or columns when missingness is random and minimal, or filling values with a summary statistic [5]. In pandas,
dropna()removes rows or columns with missing data andfillna()replaces missing values with non-missing data [7]. - Check for impossible values. A negative quantity, a week with 9 days, or 150 drinks on a Saturday are all signs of entry errors [3]. Decide whether to correct, replace, or drop each one.
- Detect outliers. An outlier is an observation that lies an abnormal distance from other values in a sample [6]. The IQR rule flags any value below $Q1 - 1.5 \times IQR$ or above $Q3 + 1.5 \times IQR$.
- Document and re-check. Re-run your counts after cleaning. If the row count changed by more than your duplicate rule predicts, something else went wrong.
Worked Example
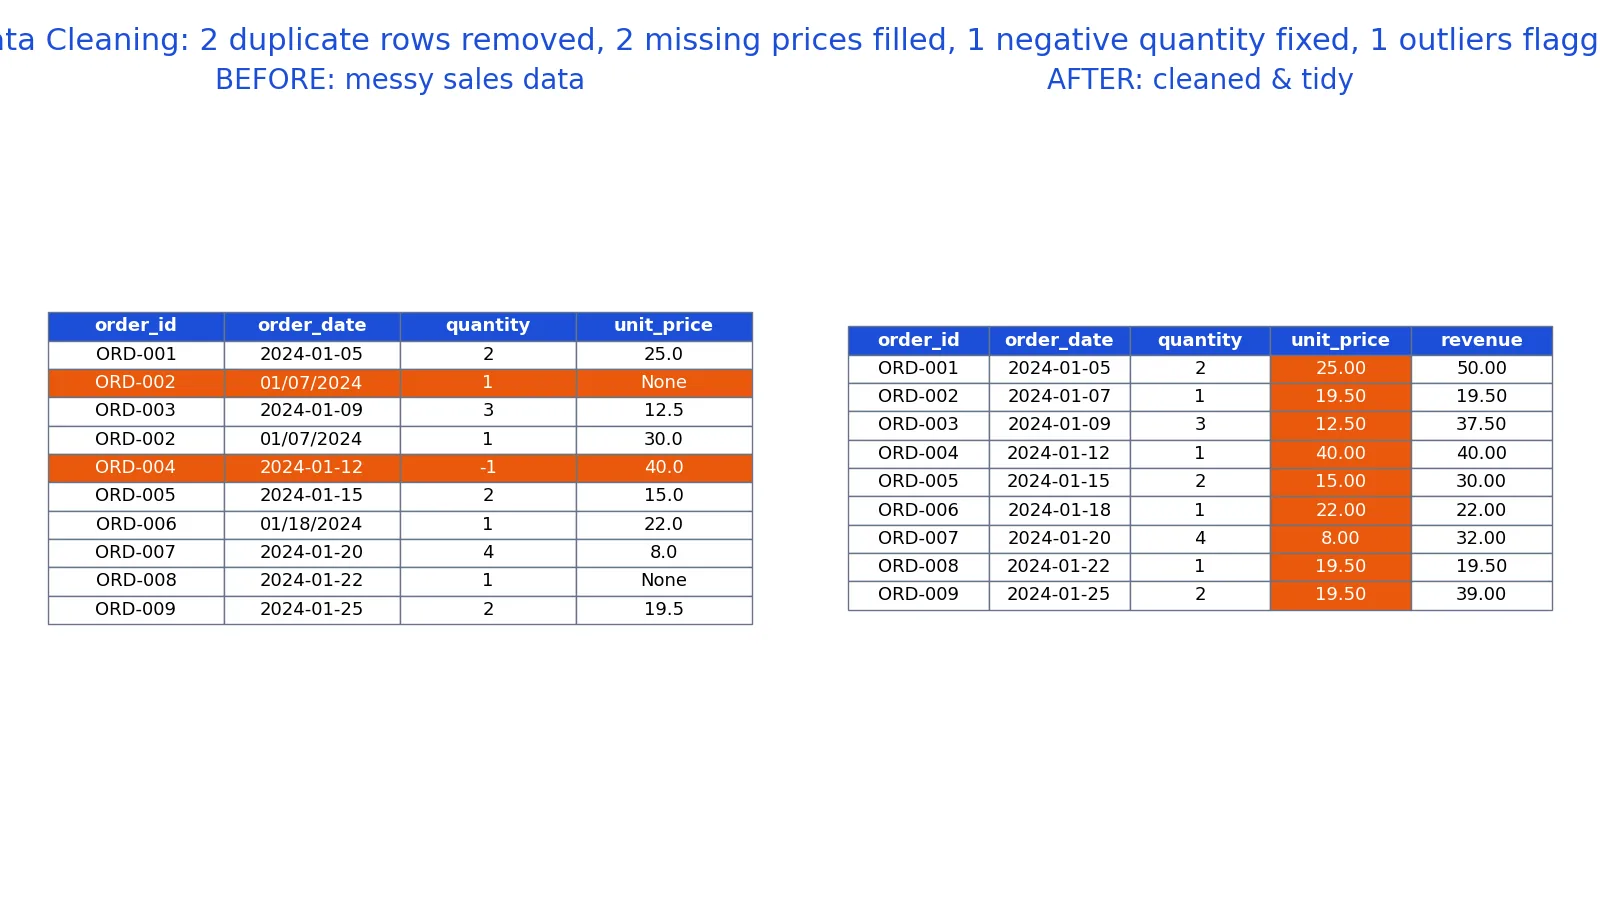
The dataset is a 10-row sales export with duplicate order IDs, mixed date formats, two missing prices, and one negative quantity.
| order_id | order_date | quantity | unit_price |
|---|---|---|---|
| ORD-001 | 2024-01-05 | 2 | 25 |
| ORD-002 | 01/07/2024 | 1 | (missing) |
| ORD-003 | 2024-01-09 | 3 | 12.5 |
| ORD-002 | 01/07/2024 | 1 | 30 |
| ORD-004 | 2024-01-12 | -1 | 40 |
| ORD-005 | 2024-01-15 | 2 | 15 |
| ORD-006 | 01/18/2024 | 1 | 22 |
| ORD-007 | 2024-01-20 | 4 | 8 |
| ORD-008 | 2024-01-22 | 1 | (missing) |
| ORD-009 | 2024-01-25 | 2 | 19.5 |
The cleaning steps and their measured effects:
| Step | Result |
|---|---|
| Raw rows | 10 rows loaded |
| Duplicate order_ids found | 2 rows share an order_id |
| After drop_duplicates | 9 rows remain |
| Missing unit_price values | 2 missing |
| Median unit_price used to fill | median = 19.5000 |
| Negative quantities | 1 row with quantity < 0, replaced by abs() |
| IQR outlier bounds | Q1 = 15.0000, Q3 = 22.0000, IQR = 7.0000, lower = 4.5000, upper = 32.5000 |
| Outliers detected | 1 price outside bounds |
| Total revenue | sum(quantity * unit_price) = 289.5000 |
Two rows share ORD-002, so dropping duplicates on order_id leaves 9 rows. The two blank prices are filled with the median of 19.50. The single negative quantity becomes positive. One price sits outside the IQR bounds and is flagged rather than deleted. The final revenue is 289.50.
import pandas as pd

df = pd.read_csv("sales.csv")
df = df.drop_duplicates(subset="order_id", keep="first")
df["order_date"] = pd.to_datetime(df["order_date"], format="mixed")
df["unit_price"] = df["unit_price"].fillna(df["unit_price"].median())
df["quantity"] = df["quantity"].abs()
q1, q3 = df["unit_price"].quantile([0.25, 0.75])
iqr = q3 - q1
df["outlier"] = (df["unit_price"] < q1 - 1.5*iqr) | (df["unit_price"] > q3 + 1.5*iqr)
df["revenue"] = (df["quantity"] * df["unit_price"]).round(2)
print(df["revenue"].sum())  # 289.50
Output:
rows_before=10, rows_after=9, duplicates_removed=1, missing_prices_filled=2, median_price=19.5000, negative_quantities_fixed=1, outliers_flagged=1, total_revenue=289.5000Other Ways to Do It
You do not need Python for any of this. Spreadsheets handle the same four problems with built-in features, and the logic is identical.
| Task | Spreadsheet approach |
|---|---|
| Duplicates | Remove Duplicates on the key column |
| Missing values | Filter blanks, then type the median into the empty cells |
| Negative quantities | =ABS(cell) in a helper column |
| Outlier bounds | =QUARTILE.INC(range,1) and =QUARTILE.INC(range,3) |
For a formula-driven view of a subset, the Excel FILTER function lets you isolate rows that meet a condition without deleting anything. If your cleaning is really about reshaping and joining sources, that work belongs to data wrangling, which is a broader activity than cleaning alone. And if you are cleaning a database rather than a file, the structural rules in database normalization determine where duplicates can even exist.
Troubleshooting
The row count dropped more than expected. Your duplicate rule matched on too few columns. Check whether two genuinely different orders share an ID.
Dates parsed into the wrong month. Day-first and month-first formats look identical for the first 12 days of a month. Parse with an explicit format instead of letting the parser guess.
The median changed after filling. This happens if you compute the median after inserting filled values. Compute it once, store it, and reuse that number.
Outlier flags keep appearing on legitimate values. A skewed distribution produces high IQR flags naturally. Look at the histogram before trusting the bounds [6].
Filling missing values made the column less variable. Imputing with a single constant shrinks variance and narrows confidence intervals. Note this in your methods.
Common Mistakes
- Deleting outliers on sight. Outliers often contain valuable information about the process or the recording step [6]. Fix: investigate first, flag second, delete only with a stated reason.
- Filling missing values with the mean on skewed data. The mean is pulled by extreme values. Fix: use the median for skewed numeric columns.
- Dropping every row with any blank cell. This can remove most of your data when missingness is spread across columns. Fix: check the pattern of missingness before deciding [3].
- Cleaning without recording the before and after counts. You cannot report what you cannot reconstruct. Fix: log row counts at each step.
- Treating "N/A", "n/a", "NA" and blank as different values. They are the same missing value wearing four costumes. Fix: standardize missing codes before counting [3].
- Cleaning the only copy of the file. Fix: keep the raw file read-only and write cleaned output to a new file.
Limitations
Cleaning cannot rescue a badly designed study or a badly collected dataset [4]. If the data collection instrument allowed a value of 150 drinks per Saturday, cleaning can flag it but cannot tell you what the respondent meant. Imputation also invents data. Filling two missing prices with 19.50 produces a complete column, but those two values are estimates, not observations, and any statistic that depends on them carries extra uncertainty.
The IQR rule is a screening tool, not a verdict. It assumes nothing about the distribution, which makes it widely applicable, but it also flags values that are perfectly valid in skewed data. The same caution applies to any automated rule: it detects suspected problems, and a human still has to diagnose and decide [4].
Frequently Asked Questions
What is the difference between data cleaning and data cleansing?
They mean the same thing. Data cleansing, database cleaning, and dataset cleaning are all names for the process of detecting and correcting dirty data before analysis [2]. Pick one term and use it consistently in your documentation.
Should I remove or fill missing values?
It depends on how much is missing and why. Removal is reasonable when missingness is random and minimal [5]. Filling is better when dropping rows would bias your sample, but you must state which method you used and why.
How do I decide if a value is an outlier?
Graph the data first. A histogram and a box plot show whether a point is far from the mass of values [6]. Then apply a rule such as the IQR bounds, and treat the result as a flag for review, not an automatic deletion.
Can I clean data in Excel instead of Python?
Yes. Duplicate removal, blank filtering, and quartile formulas all exist in spreadsheets. Python becomes worth the setup when the file is large, when you need to repeat the same cleaning on new exports, or when you want the steps written down as code.
How do I report data cleaning in a paper?
Describe the steps you took and the rules you applied, including how many rows were removed and how missing values were handled. Statistical societies recommend that a description of data cleaning be a standard part of reporting statistical methods [4].
References
- Get Started with Data Cleaning - Data Cleaning - Research Guides at The Claremont Colleges Library
- Normal Workflow and Key Strategies for Data Cleaning Toward Real-World Data: Viewpoint - PMC
- Data Quality + Cleaning | Research Data | Nebraska
- Data Cleaning: Detecting, Diagnosing, and Editing Data Abnormalities - PMC
- Data Cleaning Techniques - Data Cleaning and Wrangling Guide - Research & Subject Guides at Stony Brook University
- 7.1.6. What are outliers in the data?
- Working with missing data, pandas 3.0.6 documentation
Related Articles
- Dataset Examples: Types of Data Sets With Real Samples
- What Is Data Preprocessing? Steps, Techniques and Examples
- Data Manipulation Language (DML): Definition and Examples
- What Is Data Wrangling? Definition, Steps and Examples
- Database Normalization: 1NF, 2NF, 3NF Explained with Examples
- Data Cleaning in Biostatistics
- Data Management Basics: Principles, Processes, and Best Practices
- Mastering Source Data and Data Entry