What Is Data Preprocessing? Steps, Techniques and Examples
By Dr. Zubair Khalid, DVM, MS, PhD ·
Data preprocessing is the work of turning raw, messy data into a clean, structured form that analysis and machine learning models can use. It covers handling missing values, correcting errors, dealing with outliers, scaling numbers and encoding categories. This article walks through each step, then applies them to a small survey dataset with real computed values.
Quick Answer
- Preprocessing converts raw data into usable structures for analysis by removing duplicates, fixing errors, handling missing values and resolving inconsistencies [1].
- Typical steps are data cleaning, data integration, data transformation and dimensionality reduction [2].
- Missing values can be filled with a summary statistic such as the mean, or dropped when the loss is small.
- Outliers are often detected with the interquartile range (IQR) rule and capped, removed or investigated.
- Categorical columns must be encoded as numbers, for example with one-hot encoding, before most models can read them.
What Preprocessing Means
In plain terms, preprocessing is everything you do to data between collecting it and analyzing it. You take a raw file with blanks, typos, odd units and text labels, and you produce a tidy table where every column has a consistent type and every row is a valid record.
The precise definition is broader. Preprocessing is the technique of organizing and converting raw data into usable structures for further analysis, and it includes extracting irrelevant or duplicate data, handling missing values, and correcting errors or inconsistencies so the data is accurate and complete [1]. In machine learning pipelines, the same term describes the sequence of steps that clean and refine data so it is reliable and suitable for AI and ML techniques [2].
Text gets its own version. Text preprocessing transforms unstructured text into a more structured format, using techniques such as tokenization, which breaks text into individual words or phrases, and lowercasing, which converts all text to lowercase to avoid multiple representations of the same word [1]. Reviews of unstructured text workflows describe removing stop words, removing punctuation, tagging parts of speech and expanding abbreviations before topic modeling or sentiment analysis [3].
How It Works
There is no single formula for preprocessing, but the individual steps have precise rules. Three matter most in practice.
Mean imputation. For a numeric column with missing entries, replace each blank with the column mean:
$$\bar{x} = \frac{\sum_{i=1}^{n} x_i}{n}$$
Here $x_i$ is each observed value, $n$ is the number of non-missing values, and $\bar{x}$ is the mean you substitute for the blanks. The sum runs only over observed values, so missing entries do not count toward $n$.
The IQR outlier rule. Sort the column and find the first quartile $Q_1$ and third quartile $Q_3$. Then:
$$IQR = Q_3 - Q_1, \qquad \text{upper fence} = Q_3 + 1.5 \times IQR$$
$Q_1$ is the value below which about 25 percent of observations fall, $Q_3$ is the value below which about 75 percent fall, and the upper fence is the threshold above which a value is flagged as a potential outlier. A matching lower fence is $Q_1 - 1.5 \times IQR$.
One-hot encoding. For a categorical column with $k$ distinct categories, create $k$ binary columns. Each row gets a 1 in the column matching its category and 0 elsewhere. This lets a model treat categories as separate signals instead of implying an order that does not exist.
Worked Example
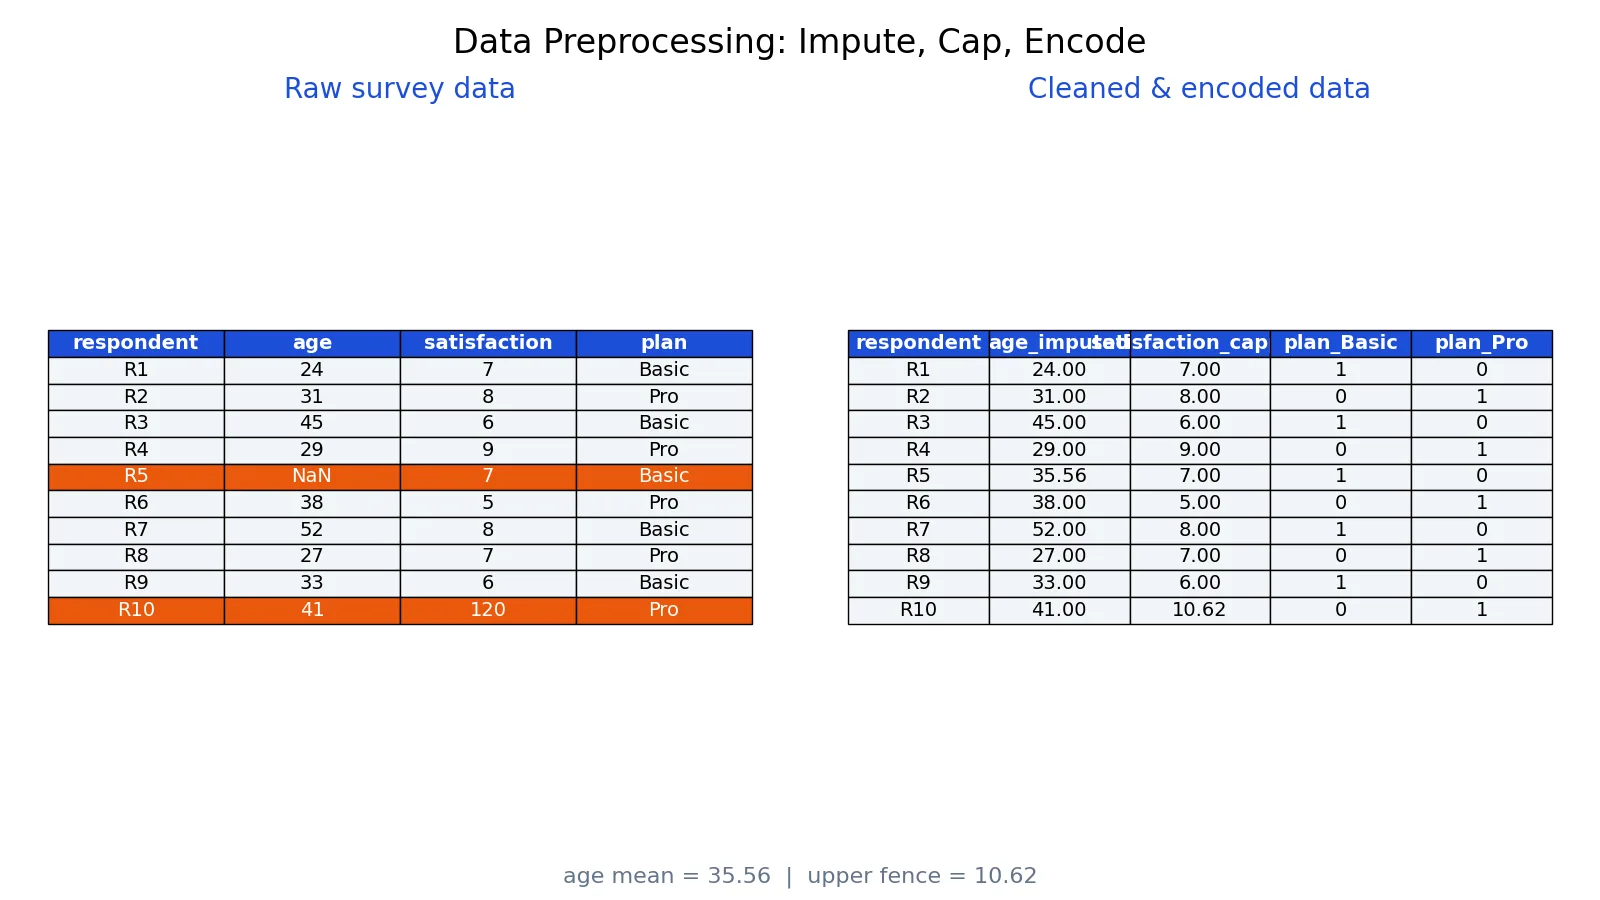
The dataset is 10 survey responses with a missing age, an outlier satisfaction score and a categorical plan column.
| respondent | age | satisfaction | plan |
|---|---|---|---|
| R1 | 24 | 7 | Basic |
| R2 | 31 | 8 | Pro |
| R3 | 45 | 6 | Basic |
| R4 | 29 | 9 | Pro |
| R5 | (missing) | 7 | Basic |
| R6 | 38 | 5 | Pro |
| R7 | 52 | 8 | Basic |
| R8 | 27 | 7 | Pro |
| R9 | 33 | 6 | Basic |
| R10 | 41 | 120 | Pro |
Step 1: impute the missing age. The observed ages sum to 320 across 9 values, so the mean is 35.5556. R5's age becomes 35.5556.
Step 2: find the satisfaction quartiles. Using the inclusive quartile method, $Q_1 = 6.2500$ and $Q_3 = 8.0000$.
Step 3: compute the IQR and upper fence. $IQR = 8.0000 - 6.2500 = 1.7500$. The upper fence is $8.0000 + 1.5 \times 1.7500 = 10.6250$.
Step 4: cap the outlier. R10's satisfaction of 120 is far above 10.6250, so it is capped at 10.6250. Capping keeps the row instead of deleting it.
Step 5: one-hot encode plan. The categories are Basic and Pro, so the single plan column becomes two binary columns.
The cleaned table has 10 rows and 5 columns. Here is the code:
import pandas as pd
df = pd.DataFrame(raw)
df['age'] = df['age'].fillna(df['age'].mean())
q1, q3 = df['satisfaction'].quantile([0.25, 0.75])
df['satisfaction'] = df['satisfaction'].clip(upper=q3 + 1.5*(q3-q1))
df = pd.get_dummies(df, columns=['plan'])
print(f"age mean = {df['age'].mean():.4f}; upper fence = {q3 + 1.5*(q3-q1):.4f}; cleaned shape = {df.shape}")
Output:
age mean = 35.5556; upper fence = 10.6250; cleaned shape = (10, 5)How to Interpret It
Read the output as a checklist of what changed. The age mean of 35.5556 tells you the imputed value sits near the center of the observed ages, which is reasonable when the missingness looks random. If the blank belonged to a respondent whose age you could predict from other columns, a model-based imputation would beat the mean.
The upper fence of 10.6250 tells you the satisfaction scale effectively runs from about 5 to 10 in this sample, so a value of 120 is almost certainly a data entry error or a different unit. Capping it at 10.6250 preserves the row while stopping one extreme value from dominating any average or model coefficient.
The final shape of (10, 5) confirms no rows were lost. You started with 4 columns and ended with 5 because one categorical column became two binary columns. That trade is normal. Encoding always expands width to preserve information.
When to Use It (and when not to)
Preprocess whenever your data comes from the real world. Survey exports, sensor logs, clinical records and scraped text all arrive with blanks, duplicates and inconsistent formats. Any downstream model trained on unprocessed data risks learning from noise, and the resulting analysis can be uninterpretable or fail to generalize [2].
Skip heavy preprocessing when the data is already curated. A clean, validated export from a controlled instrument may need nothing beyond a type check. Over-processing has real costs. Aggressive outlier removal can delete genuine rare events, and mean imputation shrinks variance, which understates uncertainty in later estimates.
Match the effort to the stakes. A quick exploratory chart tolerates rough data. A published model or a regulated analysis needs documented, reproducible steps, because omitting the preprocessing details creates reproducibility and comparability problems [4].
Preprocessing vs Data Cleaning
The two terms overlap heavily, and many people use them interchangeably. The distinction is scope.
| Aspect | Data Cleaning | Data Preprocessing |
|---|---|---|
| Scope | Fixing errors and inconsistencies | The full pipeline from raw to model-ready |
| Typical tasks | Missing values, duplicates, typos, outliers | Cleaning plus integration, transformation, encoding, reduction |
| Output | Accurate records | Accurate records in the format a model expects |
| Position | A subset of preprocessing | The umbrella term |
Data cleaning is the part of preprocessing that detects and edits abnormalities [5]. Preprocessing also covers merging sources, scaling, transforming distributions and reducing dimensionality [2]. If you only fix errors but never encode your categories, you have cleaned the data but not preprocessed it.
Common Mistakes
- Imputing before splitting. If you compute the mean on the full dataset and then split into train and test, information leaks from test into train. Fix: compute imputation values on the training set only, then apply them to the test set.
- Using the mean for skewed columns. The mean is pulled by extreme values, so it can land where no real observation sits. Fix: use the median for skewed numeric columns.
- Deleting every outlier. Some outliers are real and important. Fix: investigate first, then cap, transform or keep them, and record the decision.
- Encoding ordinal categories with one-hot. If categories have a real order, one-hot throws that order away. Fix: use ordinal encoding when the order carries meaning.
- Forgetting to apply the same steps to new data. A model trained on scaled inputs fails on raw inputs. Fix: save the fitted preprocessing steps and reuse them at prediction time.
- Skipping documentation. Without a record of what was done, results cannot be reproduced [4]. Fix: keep the script and note every transformation.
Limitations
Preprocessing cannot create information that was never collected. Mean imputation fills a blank with a plausible value, but it does not recover the true age, and it narrows the spread of the column. Every imputed cell is an estimate, and treating it as observed data overstates confidence.
There is also no universal recipe. Reviews of preprocessing across fields repeatedly find a lack of standardized best practices, with researchers applying different techniques to similar problems [2]. Choices that help one model can hurt another, and a transformation that improves accuracy on one dataset may not transfer. Document what you did, test alternatives, and treat preprocessing as a modeling decision rather than a fixed ritual.
Frequently Asked Questions
What are the main steps in preprocessing?
The core steps are data cleaning, which handles missing values, duplicates, noise and outliers, data integration, which merges sources into one dataset, data transformation, which includes normalization and aggregation, and dimensionality reduction such as feature selection [1][2]. Text data adds its own steps like tokenization and stop word removal [1].
Should I remove or impute missing values?
It depends on how much is missing and why. If only a small share of rows have blanks and the missingness looks random, imputation preserves your sample size. If a column is mostly empty or the missingness itself carries meaning, dropping it or modeling the missingness directly is often better. Always check whether missing values cluster in one group before deciding.
What is the difference between normalization and standardization?
Normalization typically rescales values into a fixed range such as 0 to 1. Standardization rescales to a mean of 0 and a standard deviation of 1. Both are transformation techniques used to put columns on comparable scales [1]. Choose based on the model. Distance-based methods usually prefer one of these, while tree-based models often need neither.
How do I handle outliers?
Start by detecting them, for example with the IQR rule where values above $Q_3 + 1.5 \times IQR$ are flagged. Then decide. You can cap the value at the fence, remove the row, transform the column, or keep it if it is a genuine observation. The right choice depends on whether the outlier is an error or a real extreme.
Does preprocessing apply to text data too?
Yes. Text preprocessing transforms unstructured text into a structured format, using tokenization to split text into words or phrases and lowercasing to merge duplicate word forms [1]. Other common steps include removing stop words and punctuation, tagging parts of speech and expanding abbreviations before analysis [3].
References
- 2.4 Data Cleaning and Preprocessing - Principles of Data Science | OpenStax
- Data Preprocessing Techniques for AI and Machine Learning Readiness: Scoping Review of Wearable Sensor Data in Cancer Care - PMC
- A scoping review of preprocessing methods for unstructured text data to assess data quality - PMC
- Overview of data preprocessing for machine learning applications in human microbiome research - PMC
- Van den Broeck J, Argeseanu Cunningham S, Eeckels R et al. (2005). Data Cleaning: Detecting, Diagnosing, and Editing Data Abnormalities. PLoS Medicine
Further Reading
- Data Preprocessing | Neuromusculoskeletal Modeling (NMSM) Pipeline
- Bland JM, Altman DG (1996). Statistics Notes: Transforming data. BMJ
Related Articles
- Data Cleaning: Step by Step Guide with Examples
- Data Manipulation Language (DML): Definition and Examples
- Structured vs Unstructured Data: Differences and Examples
- Database Normalization: 1NF, 2NF, 3NF Explained with Examples
- Dataset Examples: Types of Data Sets With Real Samples
- Common Pitfalls in MS1 and MS2 Spectral Preprocessing and How to Avoid Them
- Mastering Source Data and Data Entry
- Data Management Basics: Principles, Processes, and Best Practices