What Is a Median? Definition, Formula and Examples
By Dr. Zubair Khalid, DVM, MS, PhD ·
The median is the middle value in a data set after you sort the values from smallest to largest. If you have an odd number of values, it is the single value in the middle. If you have an even number, it is the average of the two middle values. That is the whole idea behind "what is a median," and the rest of this article shows how to apply it.
Quick Answer
- The median splits a sorted data set in half: 50% of values fall at or below it, 50% at or above it.
- For odd $n$, the median is the value at position $(n + 1) / 2$ in the sorted list.
- For even $n$, the median is the mean of the values at positions $n / 2$ and $n / 2 + 1$.
- The median ignores how far extreme values sit from the center, so outliers barely move it.
- The mean uses every value's size, so one extreme value can pull it far from the typical case.
What the Median Means
In plain language, the median is the midpoint of your data. Sort the values, find the one in the middle, and you have it. Half the observations are smaller, half are larger.
The precise statistical definition: for a data set of size $n$ sorted as $x_{(1)} \le x_{(2)} \le \dots \le x_{(n)}$, the median is the value that satisfies two conditions. At least half the observations are less than or equal to it, and at least half are greater than or equal to it. For continuous data with no ties, this pins down one value exactly.
The median is a measure of central tendency, the same family as the mean and the mode. It is also a positional measure, because it depends on where values fall in the order, not on their numeric size. Change the largest value from 812 to 8,120 and the median does not move at all.
How It Works
The formula depends on whether $n$ is odd or even.
For an odd number of values:
$$\text{Median} = x_{\left(\frac{n+1}{2}\right)}$$
For an even number of values:
$$\text{Median} = \frac{x_{\left(\frac{n}{2}\right)} + x_{\left(\frac{n}{2}+1\right)}}{2}$$
Each symbol means the following.
- $n$ is the count of values in the data set.
- $x_{(k)}$ is the $k$-th value in the sorted list, counting from the smallest.
- $(n + 1) / 2$ is the position of the middle value when $n$ is odd.
- $n / 2$ and $n / 2 + 1$ are the two middle positions when $n$ is even.
Two rules apply in every case. Sort first, because the formula refers to positions in the ordered list, not the original order. Keep ties, because repeated values still occupy separate positions.
Worked Example
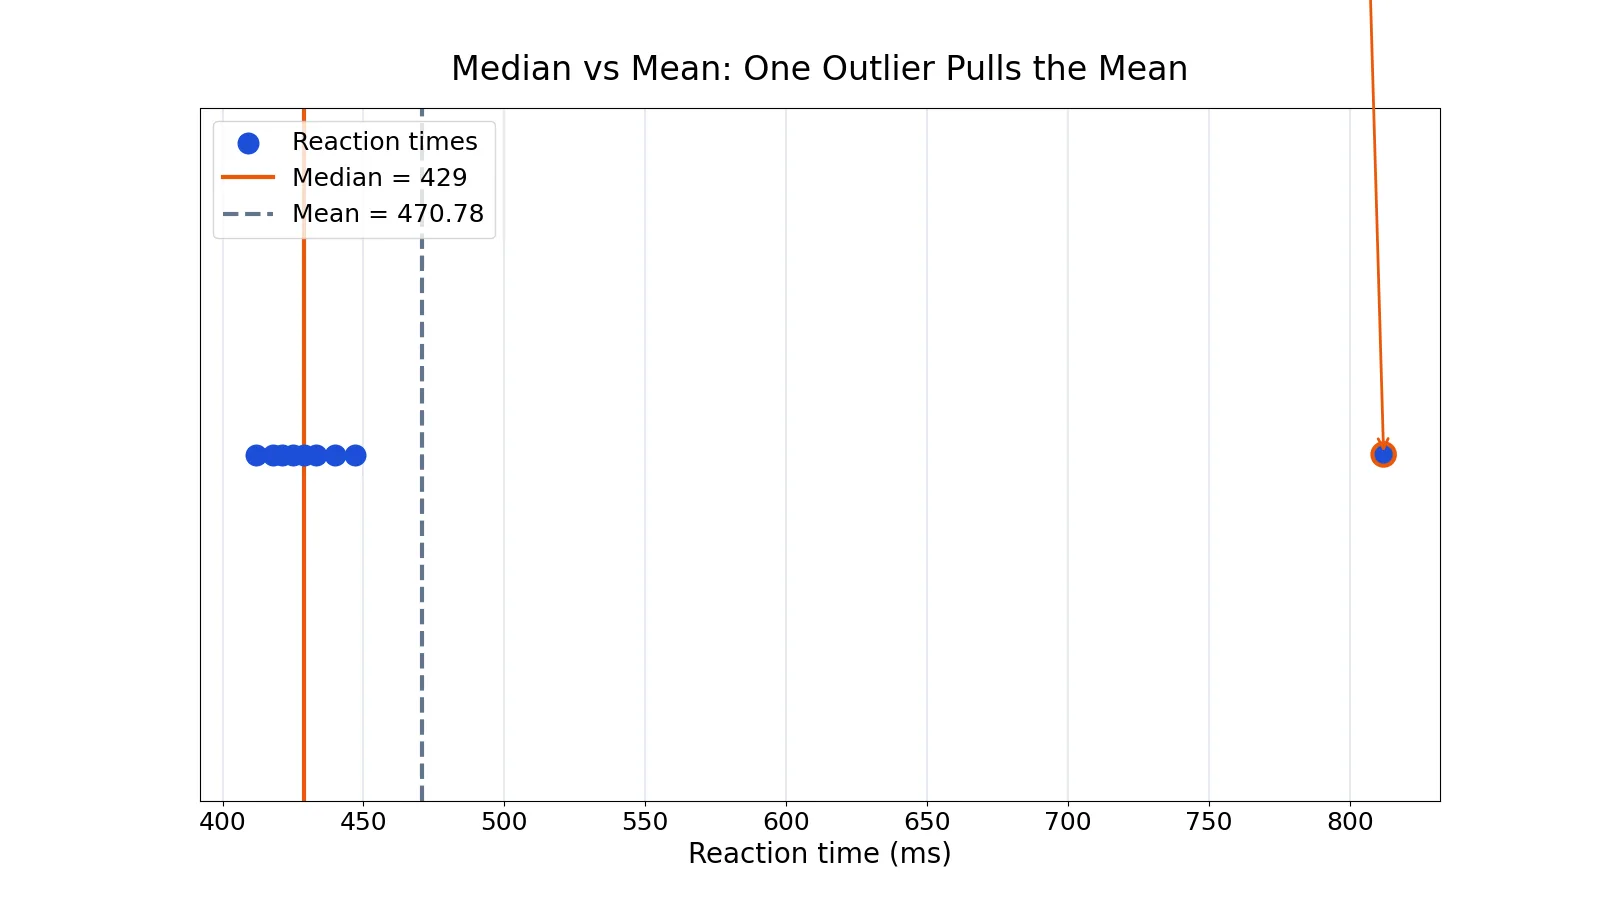
A lab assay produced nine reaction-time measurements in milliseconds, and one reading is much slower than the rest.
| reaction_time_ms |
|---|
| 412 |
| 418 |
| 421 |
| 425 |
| 429 |
| 433 |
| 440 |
| 447 |
| 812 |
Step 1. Sort the nine reaction times.
$$[412, 418, 421, 425, 429, 433, 440, 447, 812]$$
Step 2. Count the values. $n = 9$.
Step 3. Find the median position for odd $n$.
$$\frac{n + 1}{2} = \frac{9 + 1}{2} = 5.0$$
Step 4. Read the 5th sorted value. The median is 429 ms.
For comparison, the mean is the sum divided by $n$.
$$\text{mean} = \frac{4237}{9} = 470.7778$$
The sample standard deviation is $s = 128.4190$. The quartiles, using the inclusive method, are $Q1 = 421.0000$ and $Q3 = 440.0000$, so the interquartile range is $IQR = 19.0000$. The upper outlier fence is:
$$Q3 + 1.5 \times IQR = 440.0000 + 1.5 \times 19.0000 = 468.5000$$
The largest value, 812, exceeds 468.5000, so it is flagged as an outlier. The gap between the two centers is $470.7778 - 429 = 41.7778$ ms, and that gap is almost entirely the outlier's doing.
Here is the same calculation in Python.
import statistics
times = [412, 418, 421, 425, 429, 433, 440, 447, 812]
median = statistics.median(times)
mean = statistics.mean(times)
print(median, round(mean, 4))  # -> 429 470.7778
Output:
429 470.7778How to Interpret It
The median is the value a typical observation sits near when your data is skewed or contains outliers. In the example, 429 ms describes the cluster of eight fast readings well. The mean of 470.7778 ms describes no reading in the data set particularly well, because the single 812 ms value drags it upward.
Read the median as a position, not a total. It tells you where the middle of the distribution falls. It says nothing about how spread out the values are, so pair it with a spread measure such as the range or the interquartile range.
When the mean and median sit close together, the distribution is roughly symmetric and either measure works. When they diverge, the gap itself is information. A mean well above the median signals a long right tail, which is common in income, house prices, and reaction times.
When to Use It (and when not to)
Use the median when:
- Your data has outliers or a skewed distribution, such as income, wait times, or house prices.
- You have ordinal data, where the order matters but the distances between ranks do not. The median works on an ordinal scale because it only needs ranking.
- Your data is open-ended at one end, for example "500 or more," and you cannot compute a mean.
- You want a center that a single data-entry error cannot distort.
Do not use the median when:
- You need to combine groups by weighting, since medians of subgroups do not average into the overall median.
- The total matters more than the typical case, such as total revenue or total output.
- Your data is symmetric and you need the extra precision that every value contributes to the mean.
- You need a center that is mathematically tied to variance and standard deviation, which the mean is and the median is not.
Median vs Mean
Both measure the center of a data set, but they respond to extreme values in opposite ways.
| Feature | Median | Mean |
|---|---|---|
| Definition | Middle value of the sorted data | Sum of values divided by $n$ |
| Uses every value's size | No, only its position | Yes |
| Effect of an outlier | Little to none | Large |
| Works with ordinal data | Yes | No |
| Ties to standard deviation | No | Yes |
| Best for skewed data | Yes | No |
| Symbol | Often $M$ or $\tilde{x}$ | $\bar{x}$ or $\mu$ |
In the reaction-time example, the median is 429 ms and the mean is 470.7778 ms. The 41.7778 ms gap is the outlier's signature. For a fuller side-by-side treatment, see what do mean and median mean.
Common Mistakes
- Forgetting to sort. The median is a position in the ordered list. Taking the middle value of the raw data gives a meaningless number. Fix: sort ascending before you count positions.
- Using the wrong position for even $n$. With $n = 10$, the middle positions are 5 and 6, not 5 alone. Fix: average the values at positions $n/2$ and $n/2 + 1$.
- Rounding the position. For $n = 8$, $(n + 1) / 2 = 4.5$, which is a position between two values, not a value. Fix: treat a fractional position as a signal to average the two neighbors.
- Dropping or merging ties. Two identical values still occupy two positions. Fix: keep every observation in the sorted list, duplicates included.
- Reporting the median as if it were a total. The median of five salaries is not the payroll. Fix: use the mean or the sum when totals matter.
- Comparing medians across groups with different sizes without checking the distributions. A higher median does not mean every value in that group is higher. Fix: look at the spread and shape alongside the center.
Limitations
The median throws away most of the information in your data. It uses position only, so two data sets with completely different spreads can share the same median. It is also unstable in small samples in a different way than the mean: with an even count, the median is an average of two values and may not appear in the data at all.
Medians do not add up. If you split a data set into groups and take each group's median, you cannot combine those medians to recover the overall median. The same problem appears with weighted reporting, where a subgroup median carries no natural weight. For skewed data where you still want some of the mean's sensitivity, a trimmed mean that drops a fixed percentage from each tail is a middle path.
Frequently Asked Questions
What is the median if there are two middle numbers?
Average them. For an even count, the median is the mean of the two values at positions $n/2$ and $n/2 + 1$ in the sorted list. With the values 10, 20, 30, 40, the middle positions are 2 and 3, so the median is $(20 + 30) / 2 = 25$.
Does the median have to be a value in the data set?
No. For an odd count it always is, because it is one of the sorted values. For an even count it is the average of two values and may fall between them, as 25 does in the example above.
What does median mean when the data is skewed?
It means the center of the ordering, which is usually a better summary of the typical case than the mean. In right-skewed data such as incomes, the mean sits above the median because a few very large values pull it up. The median stays near the bulk of the observations.
How do I find the median in Excel or R?
Excel has a MEDIAN function that takes a range of cells and returns the middle value, with no sorting required. R has a median function that works the same way on a numeric vector. Step-by-step instructions are in how to calculate median in Excel and how to find the median in R.
Can I calculate the median of categorical data?
Only if the categories have a meaningful order. The median needs ranking, so it works for ordinal data such as survey responses from "strongly disagree" to "strongly agree." For unordered categories such as colors or city names, use the mode instead. You can check both at once with the Mean, Median & Mode Calculator.
References
This article draws on the standard references listed under Further Reading.
Further Reading
- NIST/SEMATECH e-Handbook of Statistical Methods
- OpenStax. Introductory Statistics 2e
- Krzywinski M, Altman N (2013). Importance of being uncertain. Nature Methods
- Krzywinski M, Altman N (2013). Significance, P values and t-tests. Nature Methods
- Wasserstein RL, Lazar NA (2016). The ASA Statement on p -Values: Context, Process, and Purpose. The American Statistician
- Greenland S, Senn SJ, Rothman KJ et al. (2016). Statistical tests, P values, confidence intervals, and power: a guide to misinterpretations. European Journal of Epidemiology