What Is a Proportion? Definition, Formula and Examples
By Dr. Zubair Khalid, DVM, MS, PhD ·
A proportion is the number of items in one category divided by the total number of items. It answers the question "what proportion of the whole falls into this group?" and its value always sits between 0 and 1. Multiply a proportion by 100 and you get a percentage.
Quick Answer
- A proportion is a part divided by a whole: $p = x / n$.
- Its value runs from 0 to 1. A percentage is a proportion multiplied by 100 [1].
- Proportions summarize nominal variables, where categories have no natural order [1].
- In a survey of 200 students, 60 preferred online classes, so $p = 60 / 200 = 0.3000$, or 30%.
- A proportion describes your sample. A confidence interval estimates the population value behind it.
What Proportion Means
In plain language, a proportion tells you how large one slice is relative to the entire pie. If 60 of 200 students prefer online classes, the proportion is 0.30. That single number lets you compare groups of different sizes on equal footing.
The precise statistical definition is narrower. A proportion is a particular type of ratio where a part is divided by the whole [1]. It is usually written as a decimal between 0 and 1, or as a phrase such as "60 out of 200" [1]. Because the numerator is always a subset of the denominator, a proportion can never exceed 1. A general ratio has no such limit, which is the main thing that separates the two ideas.
The word also has a second life in mathematics. There, a proportion is a statement that two ratios are equal, written as $a/b = c/d$ [2]. That usage appears in algebra and geometry problems. In data analysis, the part-over-whole meaning is the one you will meet almost every time.
How It Works
The formula for a sample proportion is:
$$p = \frac{x}{n}$$
Each symbol has a specific job:
- $x$ is the count of items in the category you care about. It is sometimes called the number of successes.
- $n$ is the total number of items in the sample, also called the sample size.
- $p$ is the proportion, a decimal between 0 and 1.
Because $p$ comes from a sample, it is an estimate. Statisticians write it as $\hat{p}$, read as "p-hat," to mark it as a sample value. The standard error measures how much that estimate would bounce around if you repeated the study:
$$SE = \sqrt{\frac{p(1-p)}{n}}$$
A 95% confidence interval is then:
$$p \pm z \cdot SE$$
where $z$ is the critical value from the normal distribution, 1.9600 for 95% confidence. This interval gives a range of plausible values for the true population proportion. If you want to compare proportions across categories first, the ideas in example of a ratio cover the ratio side of the family.
Worked Example
A survey asked 200 students whether they prefer online or in-person classes. The responses break down like this:
| Response | Count |
|---|---|
| Online | 60 |
| In-person | 140 |
The sample size is $n = 200$ and the count for the category of interest is $x = 60$.
Step 1. Compute the proportion.
$$p = \frac{60}{200} = 0.3000$$
Step 2. Compute the standard error.
$$SE = \sqrt{\frac{0.3000 \times 0.7000}{200}} = 0.0324$$
Step 3. Find the critical z value for 95% confidence. That value is 1.9600.
Step 4. Compute the margin of error.
$$1.9600 \times 0.0324 = 0.0635$$
Step 5. Build the interval.
- Lower bound: $0.3000 - 0.0635 = 0.2365$
- Upper bound: $0.3000 + 0.0635 = 0.3635$
Step 6. Convert to a percentage.
$$0.3000 \times 100 = 30.0000\%$$
Here is the same calculation in Python:
import math
from scipy import stats
n = 200
x = 60
p_hat = x / n
se = math.sqrt(p_hat * (1 - p_hat) / n)
z = stats.norm.ppf(0.975)
ci = (p_hat - z*se, p_hat + z*se)
print(f"p_hat = {p_hat:.4f}, 95% CI = ({ci[0]:.4f}, {ci[1]:.4f})")
Output:
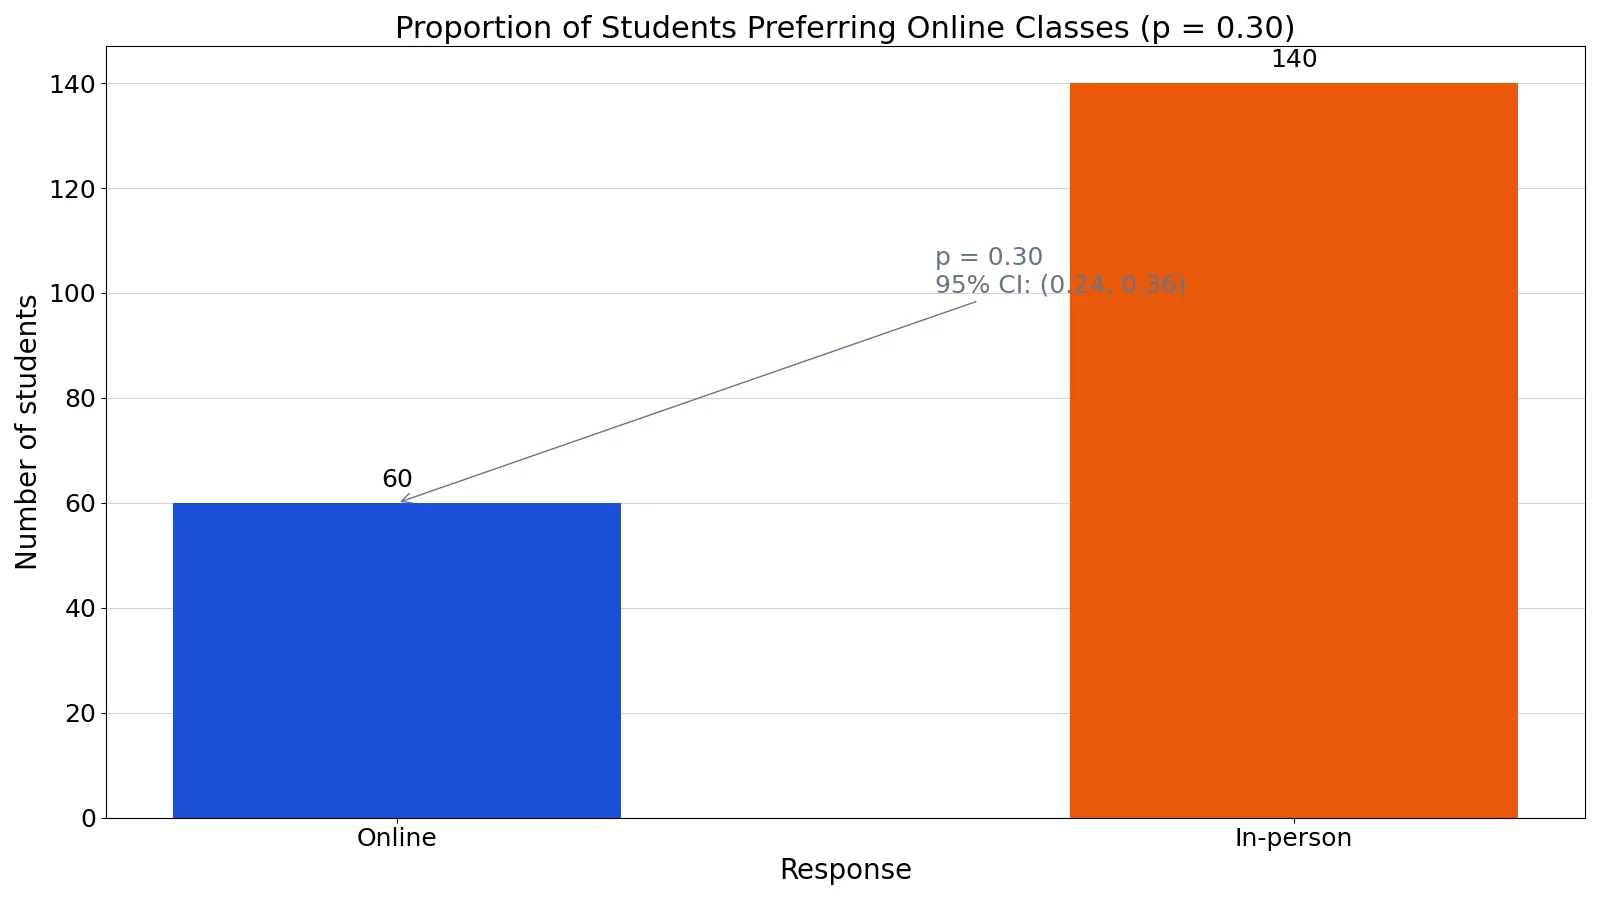
p_hat = 0.3000, 95% CI = (0.2365, 0.3635)The bar chart of these responses shows 60 students choosing online classes against 140 choosing in-person, with the proportion at $p = 0.30$ and a 95% confidence interval from 0.24 to 0.36.
How to Interpret It
Read the point estimate first. A proportion of 0.30 means 30% of the sampled students preferred online classes. The complement, $1 - p = 0.70$, is the share in every other category combined. Those two numbers always add to 1 when the variable has exactly two categories.
Then read the interval. The 95% confidence interval of 0.2365 to 0.3635 says that if you repeated this survey many times, about 95% of the intervals you built would contain the true population proportion. It does not say there is a 95% chance the true value sits in this particular range. The interval is wide here because 200 students is a modest sample. A larger sample would narrow it.
Finally, compare against a benchmark. If a previous year's survey found 25% online preference, the current estimate of 30% is higher, but the interval still includes values below 0.25 only if it dips that low. Here the lower bound is 0.2365, so 0.25 sits inside the interval and the change is not clearly distinguishable from noise.
When to Use It (and when not to)
Use a proportion when your variable is nominal, meaning the categories are labels with no order, and you want to describe how much of the whole falls into one category [1]. Survey responses, defect counts, pass or fail outcomes and click or no-click events all fit this pattern. Proportions are also the natural input for the standard error and confidence interval formulas above.
Do not use a proportion when the categories have a meaningful order or when the values are measurements. For ordered categories, a median or a quartile describes the data better. For measured quantities such as height or income, use a mean. Also avoid proportions when the denominator is tiny. With $n = 5$, a single item swings the proportion by 0.20, and the confidence interval becomes so wide that it carries little information.
Proportion vs Percentage
These two terms describe the same relationship in different units. A percentage is a proportion multiplied by 100 [1]. The table below shows how they line up.
| Feature | Proportion | Percentage |
|---|---|---|
| Formula | $p = x / n$ | $p \times 100$ |
| Range | 0 to 1 | 0% to 100% |
| Example value | 0.3000 | 30.0000% |
| Typical use | Calculation and modeling | Reporting to a general audience |
| Symbol | $p$ or $\hat{p}$ | % |
The percentage form exists mainly because it reads more naturally to a wide audience [1]. Statisticians usually keep the decimal form during calculation, because formulas such as the standard error assume a value between 0 and 1. If you need to move between the two, the steps in how to calculate a percentage cover the conversion in detail.
Common Mistakes
- Dividing the part by the other part instead of the whole. Using 60/140 gives 0.4286, which is a ratio, not a proportion. Fix: divide by the total, so 60/200.
- Reporting a proportion as a percentage without converting. Writing "the proportion is 30" is wrong. Fix: write 0.30 as a proportion, or 30% as a percentage.
- Treating the sample proportion as the population value. The estimate 0.3000 is not the truth, it is a point estimate. Fix: report the confidence interval alongside it.
- Ignoring the sample size. A proportion of 0.30 from 20 people and from 2,000 people look identical but mean very different things. Fix: always state $n$.
- Using the normal interval for very small counts. When $x$ is close to 0 or $n$ is small, the normal approximation performs poorly. Fix: use an exact method such as the Clopper-Pearson interval.
- Adding proportions from overlapping categories. If a student can select two options, the proportions can sum past 1. Fix: check whether categories are mutually exclusive before summing.
Limitations
A proportion compresses a whole distribution into one number, so it hides everything about the shape of the data. Two datasets can share the same proportion while differing in almost every other respect. It also discards information about which specific items fall in the category, which matters when the items are not interchangeable.
The confidence interval has its own limits. The normal approximation used above assumes a reasonably large sample and a proportion away from 0 and 1. When counts are small, the interval can extend below 0 or above 1, which is impossible for a real proportion. Exact methods avoid that problem but produce wider intervals. Neither approach fixes a biased sample. If the 200 students were recruited from a single lecture hall, the interval is precise about the wrong population.
Frequently Asked Questions
What proportion means in simple terms?
A proportion is one part divided by the total. If 60 out of 200 students prefer online classes, the proportion is 0.30. It tells you what fraction of the whole belongs to a single category.
What is the difference between a proportion and a ratio?
A ratio divides one number by another and has no upper limit. A proportion is a specific ratio where the numerator is part of the denominator, so it always falls between 0 and 1 [1]. The ratio 423/133 from a pea cross equals 3.18 to 1, while a proportion from the same data would divide by the total [1].
How do you calculate a proportion?
Divide the count in your category by the total count. In the survey example, 60 divided by 200 equals 0.3000. Multiply by 100 if you want the percentage form, which gives 30%.
Can a proportion be greater than 1?
No. Because the numerator is always a subset of the denominator, the maximum value is 1, which means every item falls in the category. If your calculation produces a number above 1, you divided by the wrong total.
What is a confidence interval for a proportion?
It is a range of plausible values for the true population proportion. For the survey, the 95% confidence interval runs from 0.2365 to 0.3635. It is built from the standard error and a critical z value of 1.9600.
When should you use a proportion instead of a mean?
Use a proportion for nominal categories such as yes or no, pass or fail, or online versus in-person. Use a mean for measured quantities such as height, income or test scores. The choice depends on the measurement scale of your variable, not on the size of the dataset.
References
- Measures of Proportion - Introduction to Data Analysis and R - Subject & Course Guides at Miami University
- Proportion (mathematics) - Wikipedia)
Further Reading
- NIST/SEMATECH e-Handbook of Statistical Methods
- OpenStax. Introductory Statistics 2e
- Krzywinski M, Altman N (2013). Importance of being uncertain. Nature Methods
- Krzywinski M, Altman N (2013). Significance, P values and t-tests. Nature Methods