Sample Mean: Definition, Formula and Examples
By Dr. Zubair Khalid, DVM, MS, PhD ·
The mean and sample mean both describe an average, but they answer different questions. The mean of a population is a fixed value you usually cannot observe, while the sample mean is the average you calculate from the observations you actually collected. This article defines both, gives the formula, and walks through a full calculation.
Quick Answer
- The sample mean is the sum of your observations divided by the number of observations: $\bar{x} = \frac{\sum x}{n}$.
- It is a statistic, computed from a sample, and it estimates the population mean $\mu$, which is a parameter [1].
- Because a sample is random, the sample mean is a random variable. It varies from sample to sample in a way you cannot predict with certainty [1].
- The average of all possible sample means equals the population mean, so the sample mean is unbiased for $\mu$ [2].
- Its standard deviation is $\sigma_{\bar{X}} = \frac{\sigma}{\sqrt{n}}$, called the standard error of the mean [2].
What the Sample Mean Means
In plain terms, the sample mean is the ordinary average of the values you measured. If you record 12 reaction times, add them up, and divide by 12, you have the sample mean.
The precise statistical definition is narrower. A statistic, such as the sample mean or the sample standard deviation, is a number computed from a sample. Since a sample is random, every statistic is a random variable: it varies from sample to sample in a way that cannot be predicted with certainty [1]. The sample mean is written $\bar{x}$ for a specific set of values and $\bar{X}$ when it is treated as a random variable [2].
The population mean, written $\mu$, is the average of every value in the population. It is a parameter, a fixed but usually unknown number. Sample statistics are typically not ends in themselves. They are computed in order to estimate the corresponding population parameters [1].
How It Works
The formula for the sample mean is:
$$\bar{x} = \frac{\sum_{i=1}^{n} x_i}{n}$$
Each symbol has a specific job:
| Symbol | Meaning |
|---|---|
| $\bar{x}$ | The sample mean, read as "x bar" |
| $x_i$ | The $i$-th observation in your sample |
| $\sum$ | Summation, add up all the values |
| $n$ | The number of observations in the sample |
| $\mu$ | The population mean, the value you are estimating |
| $\sigma$ | The population standard deviation |
The mechanism is simple. You add every observation, then divide by how many observations you have. That is the same arithmetic as any average. The difference is what the result represents: an estimate of $\mu$ based on a subset of the population.
Two properties make the sample mean useful. First, the mean of the sampling distribution of $\bar{X}$ equals the population mean $\mu$ [2]. Second, the standard deviation of $\bar{X}$ is $\sigma_{\bar{X}} = \frac{\sigma}{\sqrt{n}}$, which shrinks as the sample grows [2]. The sampling distribution of the mean approaches a normal distribution as $n$ increases, even when the population is not bell shaped [3].
Worked Example
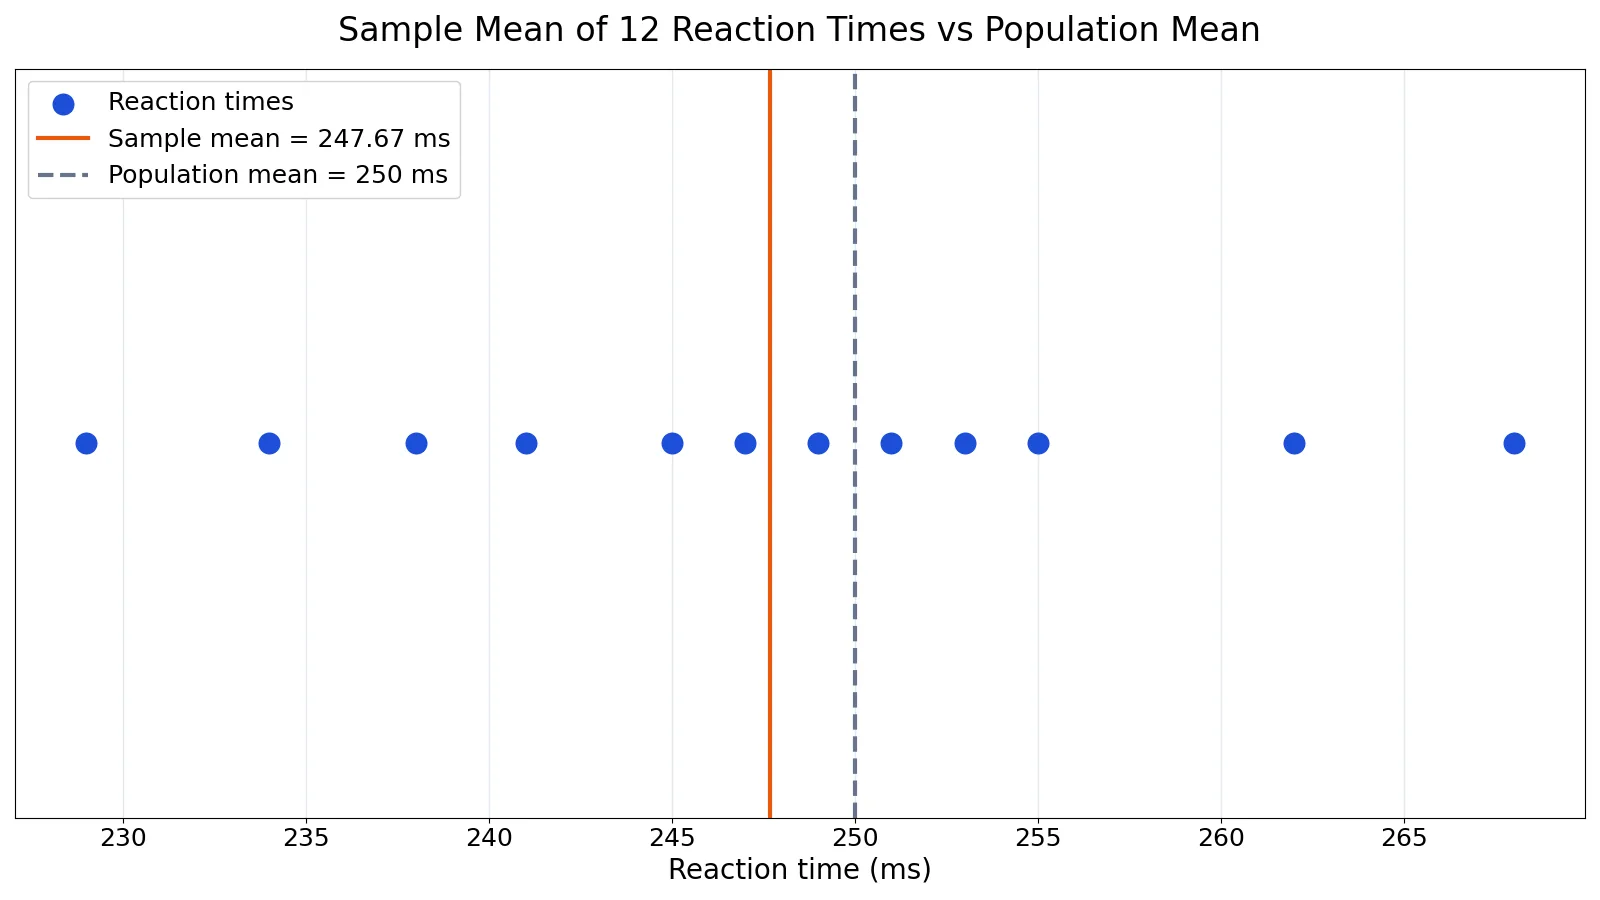
Suppose you run 12 trials of a simple visual task and record the reaction time in milliseconds for each trial.
| Trial | Reaction time (ms) |
|---|---|
| 1 | 238 |
| 2 | 245 |
| 3 | 251 |
| 4 | 262 |
| 5 | 229 |
| 6 | 247 |
| 7 | 255 |
| 8 | 241 |
| 9 | 268 |
| 10 | 234 |
| 11 | 249 |
| 12 | 253 |
The observations are 238, 245, 251, 262, 229, 247, 255, 241, 268, 234, 249, 253.
Step 1. Count the observations: $n = 12$.
Step 2. Sum the observations: $\sum x = 2972$.
Step 3. Apply the formula: $\bar{x} = \frac{\sum x}{n}$.
Step 4. Substitute and divide: $\bar{x} = \frac{2972}{12} = 247.6667$.
The sample mean is 247.6667 ms. If the population mean for this task is 250 ms, the difference is $247.6667 - 250 = -2.3333$ ms. The sample mean sits slightly below the population mean, which is normal sampling variation. The sample standard deviation for these data is 11.26 ms.
You can reproduce this in Python:
import statistics
times = [238, 245, 251, 262, 229, 247, 255, 241, 268, 234, 249, 253]
sample_mean = statistics.mean(times)
print(round(sample_mean, 4))  # prints 247.6667
Output:
247.6667If you want to check several averages at once, the Mean, Median & Mode Calculator handles the arithmetic for you.
How to Interpret It
The sample mean is your best single-number estimate of the population mean. It is a point estimate, so it comes with no built-in statement of how far off it might be. To judge that, you need the standard error, $\frac{\sigma}{\sqrt{n}}$, which describes how much sample means vary around $\mu$ [4].
A useful way to think about it: each sample mean is only an approximation of the population mean, because sampling variability causes sample means to vary from the population mean. The term standard error refers to the sampling error that results when sample means are used to estimate the population mean [4].
The sample mean is also sensitive to extreme values. One unusually large or small observation pulls the average toward it. If your data are skewed or contain outliers, report the median alongside the mean so readers see both the center and the shape.
When to Use It (and when not to)
Use the sample mean when your data are quantitative, roughly symmetric, and measured on an interval or ratio scale. It is the natural summary for reaction times, heights, test scores, temperatures, and similar measurements. It is also the input to many other procedures, including the standard error of the mean and confidence intervals.
Avoid leaning on the sample mean alone when:
- The distribution is strongly skewed or has heavy outliers. The median describes the typical value better.
- The data are ratios or growth rates. The geometric mean is the right average for multiplicative change.
- The data are rates such as speeds or prices per unit. The harmonic mean fits those cases.
- Your sample is not representative. Facts about a sample are not necessarily facts about the population, and adequacy depends on whether the sample is random and large enough [5].
Sample Mean vs Population Mean
The two differ in what they describe and whether you can know them.
| Feature | Sample mean ($\bar{x}$) | Population mean ($\mu$) |
|---|---|---|
| What it describes | A subset of the population | The entire population |
| Type | Statistic | Parameter |
| Known? | Yes, you compute it | Usually unknown |
| Fixed or variable | Varies from sample to sample | Fixed |
| Role | Estimates $\mu$ | The target of estimation |
| Notation as a random variable | $\bar{X}$ | Not applicable |
The mean of the sampling distribution of $\bar{X}$ is exactly the population mean $\mu$ [2]. That equality is what makes the sample mean a sensible estimator. The variance of the sample mean is much smaller than the variance of the population distribution, and it shrinks as $n$ grows [6].
Common Mistakes
- Dividing by the wrong count. Use $n$, the number of observations, not the number of groups or trials in an experiment. If you averaged 12 reaction times, divide by 12.
- Confusing the sample mean with the population mean. $\bar{x}$ is computed from data. $\mu$ is the unknown parameter you are estimating. Writing them interchangeably hides the uncertainty in your estimate [1].
- Reporting the mean for skewed data without context. A single outlier can move the mean far from the typical value. Pair it with the median or a range summary.
- Treating one sample mean as exact. The sample mean is a random variable. A second sample of the same size would likely give a different value [2].
- Ignoring sample size when comparing means. A mean from 5 observations and a mean from 500 observations carry very different precision. Report $n$ and the standard error [4].
- Using the sample mean for categorical data. Averages of category labels are meaningless. Use counts or proportions instead.
Limitations
The sample mean cannot tell you how precise your estimate is on its own. It gives no indication of spread, sample size, or how far it might sit from $\mu$. You need the standard deviation and the standard error to make that judgment [2][4].
It also cannot fix a biased sample. If your observations are not representative of the target population, the sample mean estimates the mean of whatever you actually sampled, not the mean of the population you care about [5]. A large sample does not correct a sampling method that systematically misses part of the population. Finally, the sample mean is not resistant to outliers, so a single extreme value can distort it in ways the median would not.
Frequently Asked Questions
What is the difference between the mean and sample mean?
The mean is a general term for an average. The sample mean is the specific average computed from a sample of observations, written $\bar{x}$. The population mean, written $\mu$, is the average of the entire population. The sample mean estimates the population mean [1].
Is the sample mean always equal to the population mean?
No. Any single sample mean will usually differ from $\mu$ because of sampling variability. What is true is that the average of all possible sample means of size $n$ equals the population mean [2]. Individual sample means scatter around that value.
How do I calculate the sample mean step by step?
Add all your observations to get the sum, count how many observations you have to get $n$, then divide the sum by $n$. For the reaction time data above, the sum is 2972 and $n$ is 12, so the sample mean is 247.6667 ms.
What is the standard error of the sample mean?
It is the standard deviation of the sampling distribution of $\bar{X}$, equal to $\frac{\sigma}{\sqrt{n}}$ [2]. It measures how much sample means vary around the population mean. Larger samples produce smaller standard errors. See the standard error of the mean formula for a full walkthrough.
Does the sample mean have to come from a normal distribution?
No. The sample mean is defined for any quantitative data. When the sample size is sufficiently large, the distribution of sample means approximates a normal distribution regardless of the shape of the population [3]. That result is the Central Limit Theorem, and it is what lets you make probability statements about $\bar{X}$ relative to $\mu$ [1].
References
- 7: Sampling Distributions and the Central Limit Theorem - Statistics LibreTexts
- 6.1: The Mean and Standard Deviation of the Sample Mean - Statistics LibreTexts/06%3A_Sampling_Distributions/6.01%3A_The_Mean_and_Standard_Deviation_of_the_Sample_Mean)
- 7.2: The Central Limit Theorem for Sample Means (Averages) - Statistics LibreTexts)
- ch12key
- 3.1.3.4. Populations and Sampling
- Sample Means
Related Articles
- Mean and Standard Deviation: Definition, Formula and Examples
- How to Calculate the Mean: Formula and Step by Step Examples
- Formula for Range: Definition, Formula and Examples
- Geometric Mean: Definition, Formula and Examples
- Sample Variance Equation: Formula, Steps and Examples
- Sample Size Symbol and Notation: What You Need to Know
- Sample size standard deviation formula
- Statistical Parameter: Definition, Types, and Estimation