What Do Mean and Median Mean? Definition and Examples
By Dr. Zubair Khalid, DVM, MS, PhD ·
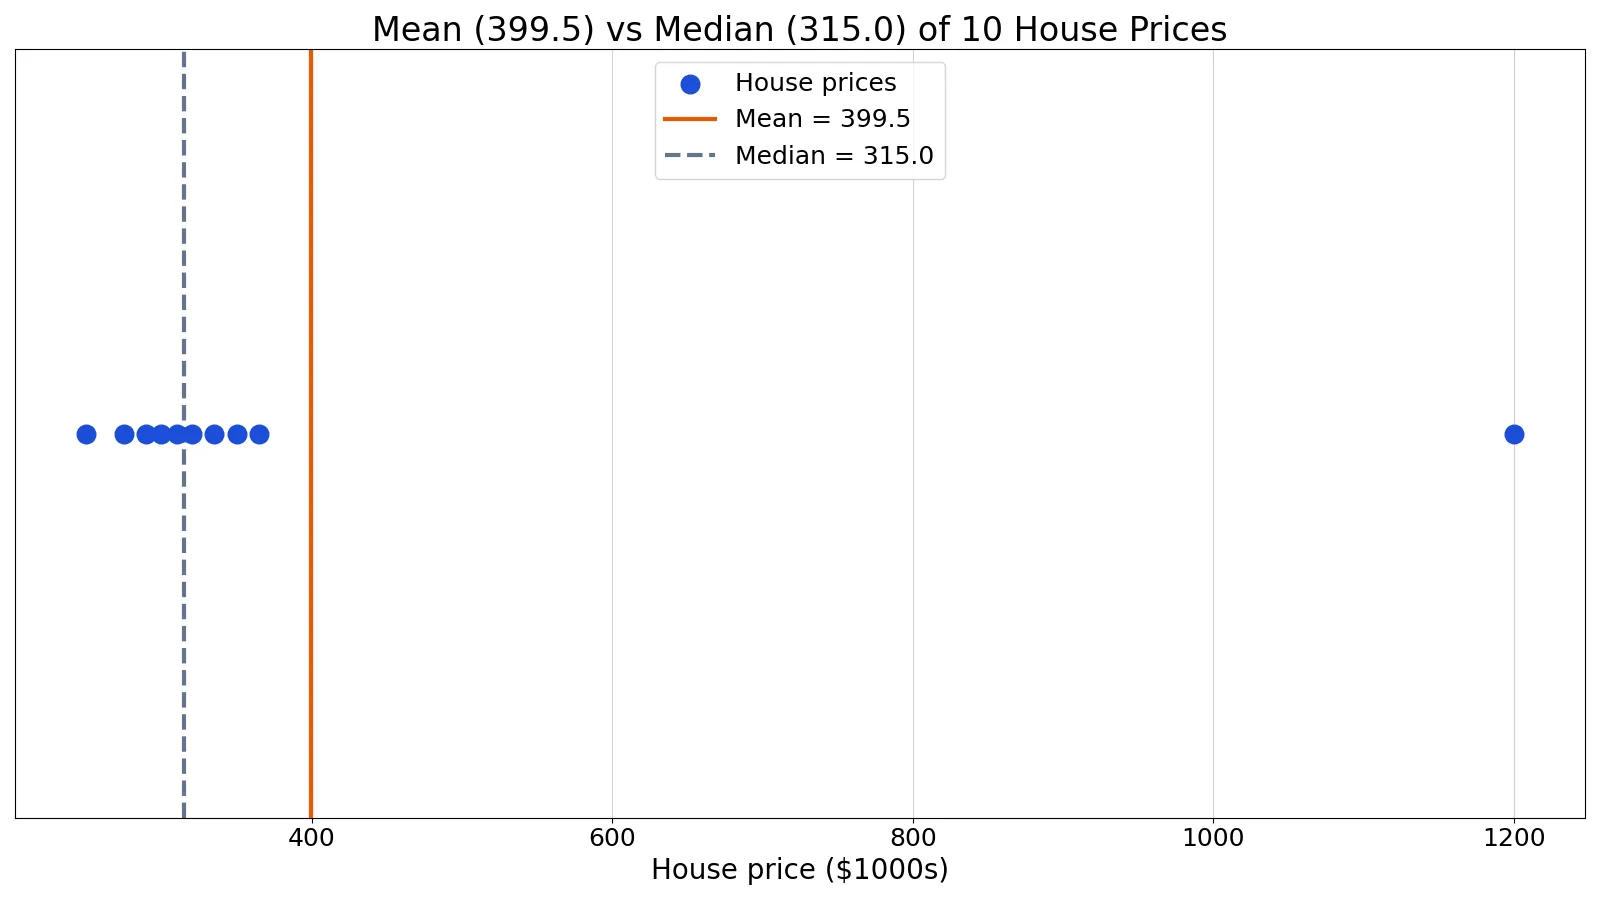
If you have ever asked "what does mean and median mean," the short version is this: both are measures of central tendency, which is a fancy way of saying they describe a typical value in a dataset. The mean is the arithmetic average, and the median is the middle value once the data is sorted. They often land close together, but they can tell very different stories when your data is skewed or contains outliers.
Quick Answer
- The mean is the sum of all values divided by the number of values. It is the "fair share" or balancing point of the data [1].
- The median is the middle value when the data is sorted. Half the values fall at or below it, and half fall at or above it [2].
- The mean is sensitive to outliers and skewed values. The median is not [3].
- For reasonably symmetric data with a central peak, the mean is a good summary. For skewed data or data with outliers, report the median [4].
- In a skewed distribution, the mean gets pulled toward the long tail while the median stays near the bulk of the data [3].
What Mean and Median Mean
In everyday language, both words point to the same idea: a single number that stands in for a whole list. That is why people use "average" loosely for either one. In statistics, the two are defined precisely and they are not interchangeable.
The mean is a number that measures the central tendency of the data, and "average" is its common name. The term "mean" is short for "arithmetic mean." For a sample, the mean is the sum of all values divided by the number of values. For a population, it is the sum of all values in the population divided by the population size [2].
The median is a number that separates ordered data into halves. Half the values are the same number or smaller than the median, and half are the same number or larger. The median may or may not be one of the actual data values [2].
That last point matters. If you average 70 and 80, you get 75, which may not appear anywhere in your data. The median can behave the same way when you have an even number of values, because you average the two middle ones.
How It Works
The sample mean is written as $\bar{x}$ and calculated like this:
$$ \bar{x} = \frac{1}{n} \sum_{i=1}^{n} x_i = \frac{x_1 + x_2 + \dots + x_n}{n} $$
Each symbol has a job:
- $x_1, x_2, \dots, x_n$ are the individual data values [3].
- $n$ is the number of values in the sample.
- $\sum$ means "add up everything that follows."
- $\bar{x}$ (read "x-bar") is the sample mean.
The population mean uses the same arithmetic but a different symbol, $\mu$ [2].
The median works by position, not by arithmetic on the values themselves. Sort the data from smallest to largest. If $n$ is odd, the median is the single middle value. If $n$ is even, the median is the average of the two middle values [3].
Because the median depends only on order, changing the size of an extreme value usually does not move it. Because the mean adds every value together before dividing, every value affects it [4].
Worked Example
Here is a small dataset of ten house prices in thousands of dollars, where one home is far more expensive than the rest.
| House | Price ($1000s) |
|---|---|
| 1 | 250 |
| 2 | 275 |
| 3 | 290 |
| 4 | 300 |
| 5 | 310 |
| 6 | 320 |
| 7 | 335 |
| 8 | 350 |
| 9 | 365 |
| 10 | 1200 |
Step 1: Sum the prices.
250 + 275 + 290 + 300 + 310 + 320 + 335 + 350 + 365 + 1200 = 3995
Step 2: Divide by the number of values.
3995 / 10 = 399.5000
So the mean price is $399,500.
Step 3: Sort the prices.
[250, 275, 290, 300, 310, 320, 335, 350, 365, 1200]
Step 4: Find the middle. With ten values, the median is the average of the 5th and 6th sorted values.
(310 + 320) / 2 = 315.0000
So the median price is $315,000.
Notice the gap. The mean sits at 399.5 while the median sits at 315.0. The $1,200,000 home pulls the mean upward, but it barely touches the median.
Step 5: Remove the outlier and recalculate.
Mean without the outlier: (3995 - 1200) / 9 = 310.5556
Median without the outlier: with nine values left, the median is the 5th sorted value, 310.0000
The mean shifted by 399.5000 - 310.5556 = 88.9444. The median shifted by 315.0000 - 310.0000 = 5.0000. Dropping one house moved the mean almost 89 units and the median only 5.
Here is the same calculation in Python:
import statistics
prices = [250, 275, 290, 300, 310, 320, 335, 350, 365, 1200]
mean = statistics.mean(prices)
median = statistics.median(prices)
print(f"mean = {mean:.4f}, median = {median:.4f}")
Output:
mean = 399.5000, median = 315.0000You can check your own numbers with the Mean, Median & Mode Calculator.
How to Interpret It
The mean is the balancing point of a distribution. If you measured the distance from each data point to the mean, the distances on each side would balance out [1]. That is a useful mental picture. It also explains the weakness: one very distant point has a lot of "weight," so it drags the balance point toward itself.
The median divides the data into two equal-sized groups. There is as much data below it as above it [1]. It tells you where the middle of the pack sits, not where the total weight sits.
A practical way to read them together: if the mean is noticeably larger than the median, the data likely has a long right tail or high outliers. If the mean is noticeably smaller, the data likely has a long left tail or low outliers. When the two are close, the distribution is probably close to symmetric [3].
When to Use It (and when not to)
Use the mean as a measure of center only for distributions that are reasonably symmetric with a central peak. When outliers are present, the mean is not a good choice [4].
Use the median for all other cases, including skewed distributions, data with outliers, and irregular shapes [4].
Income is the classic example. A small number of people with very high incomes increase the mean, so the mean can be too high to represent the large number of people earning less. The median income better represents the typical income in that sample [4].
There is a mathematical reason the median resists outliers. For the values 2, 3, 4, 9, and 16, the sum of absolute deviations from the median is 20, which is smaller than the sum of absolute deviations from the mean, 22.8. The median minimizes absolute deviations. The mean minimizes squared deviations instead, which is why it reacts strongly to extreme values [5].
Mean vs Median
| Feature | Mean | Median |
|---|---|---|
| What it measures | Arithmetic average, the balancing point | Middle value by position |
| Formula basis | Sum divided by count | Sorted order |
| Effect of outliers | Strongly affected | Barely affected |
| Works well for | Symmetric distributions with a central peak | Skewed data and data with outliers |
| Can be a non-data value | Yes | Yes, when $n$ is even |
| Symbol | $\bar{x}$ for a sample, $\mu$ for a population | Usually written "median" or "Med" |
If you want a deeper side-by-side treatment, see mean vs median differences. If you only need the middle value, what is a median covers the formula and edge cases. For the mean specifically, see the sample mean.
Common Mistakes
- Reporting the mean for skewed data. A single outlier can move the mean far from the typical value. Check the shape of your data first, then choose the median if the distribution is skewed [4].
- Forgetting to sort before finding the median. The median is a positional measure. If the data is not in order, the middle entry is meaningless [3].
- Averaging the wrong two values when $n$ is even. With ten sorted values, the middle pair is the 5th and 6th, not the 4th and 5th. Count from both ends to confirm.
- Assuming the median must be a value in the data. It often is not. For an even count, you average two middle values, and the result may appear nowhere in the dataset [2].
- Treating the mean as a description of individuals. The mean gives a sense of overall performance, not information about any single data point or how much the values vary [1].
- Using the mean and median interchangeably in a report. They answer different questions. State which one you used and why.
Limitations
Neither measure tells you about spread. Two datasets can share the same mean and median while having completely different variability, so a measure of center alone is an incomplete summary. Pair it with a measure of spread such as the standard deviation, which you can read about in mean and standard deviation.
The median also hides structure. In a dataset with two distinct clusters, such as the clementine masses that split into a lighter group and a heavier group, the median lands between the groups and represents neither one well [6]. The mean has the same problem in that case. When the shape is irregular, plot the data before you summarize it.
Frequently Asked Questions
What does mean and median mean in simple terms?
The mean is what you get when you add up all the values and divide by how many there are. The median is the value in the middle after you sort the list. Both describe a typical value, but the mean uses every number's size while the median uses only position.
Which is better, the mean or the median?
It depends on the shape of your data. Use the mean for reasonably symmetric distributions with a central peak. Use the median when the data is skewed or contains outliers, because the median is not affected by extreme values [4].
Why is the mean higher than the median in income data?
High earners pull the mean upward because the mean adds every income together. The median only cares about order, so a few very large incomes do not move it. That is why median income is usually the better description of a typical income [4].
Can the mean and median be the same?
Yes. In a perfectly symmetric distribution, the mean and median tend to be very close together, and they can be identical [3]. They diverge as the distribution becomes more skewed.
How do I find the median with an even number of values?
Sort the data, then average the two middle values. For the ten house prices above, the 5th and 6th values are 310 and 320, so the median is (310 + 320) / 2 = 315.0000 [3]. If you work in R, how to find the median in R walks through the function.
References
- 2.13: Mean and Median (1 of 2) - Statistics LibreTexts/02%3A_Summarizing_Data_Graphically_and_Numerically/2.13%3A_Mean_and_Median_(1_of_2))
- 2.4: Measures of Central Tendency- Mean, Median and Mode - Statistics LibreTexts
- 2.1: Measures of Central Tendency- Mean, Median, and Mode - Statistics LibreTexts/02%3A_Exploring_and_Summarizing_Data/2.01%3A_Measures_of_Central_Tendency-_Mean_Median_and_Mode)
- Mean and Median (2 of 2) - Concepts in Statistics
- 5.4: Median and Mean - Statistics LibreTexts
- 2.2.20: Mean, Median, Mode - Physics LibreTexts/02%3A_Units_Measurement_Graphing_and_Calculation/2.02%3A_Math_Review/2.2.20%3A_Mean_Median_Mode)