How to Calculate Median in Excel (Step by Step)
By Dr. Zubair Khalid, DVM, MS, PhD ·
To calculate the median in Excel, use the MEDIAN function on a range of numbers. Excel sorts the values internally and returns the middle one, or the average of the two middle values when the count is even. This article shows how to calculate median in Excel step by step, with a worked example, error fixes, and the limits of what the function can tell you.
Quick Answer
- Type
=MEDIAN(and then select the range of numbers, for example=MEDIAN(B2:B8). - Press Enter. Excel returns the middle value of the set.
- With an odd count, the result is the single middle number.
- With an even count, Excel averages the two middle numbers [1].
- The MEDIAN function accepts 1 to 255 numbers, and arguments can be numbers, names, arrays, or references that contain numbers [1].
Before You Start
The median is one of three common measures of central tendency, alongside the average and the mode [2]. The average adds the values and divides by the count. The median is the middle number, meaning half the values sit above it and half sit below it [3]. The mode is the most frequently occurring number [4].
For a symmetrical distribution, these three measures are the same. For a skewed distribution, they can differ [1]. That difference is the reason the median matters. A single extreme value can pull the average far away from the typical case, while the median stays near the center.
You need one thing before you start: a column or row of numbers with no text mixed into the range you select. Excel ignores text, logical values, and empty cells inside a referenced range, but it does count cells that contain zero [4]. If you type a logical value or a text representation of a number directly into the argument list, Excel counts it [1]. That distinction trips people up, so keep your data range clean and let the function do the rest.
If you want to compare the median against the mean for the same data, see How to Calculate the Mean in Excel (Step by Step).
Step by Step
- Enter your numbers in a single column, one value per cell. Leave the header in the first row if you have one.
- Click an empty cell where you want the result to appear.
- Type
=MEDIAN(to start the formula. - Select the range of numbers with your mouse, or type it directly, for example
B2:B8. - Type
)to close the formula and press Enter. - Read the result. Excel displays the middle value, or the average of the two middle values for an even count [1].
You can also reach the function through the interface. Select the Formulas tab, then select AutoSum > More Functions. Type MEDIAN in the Search for a function box and select OK [2]. The typed formula is faster once you know the syntax.
The syntax itself is short:
$$\text{MEDIAN}(number1, [number2], \dots)$$
number1 is required and later numbers are optional [1]. In practice, most people pass a single range such as B2:B100 and let Excel handle the rest.
Worked Example
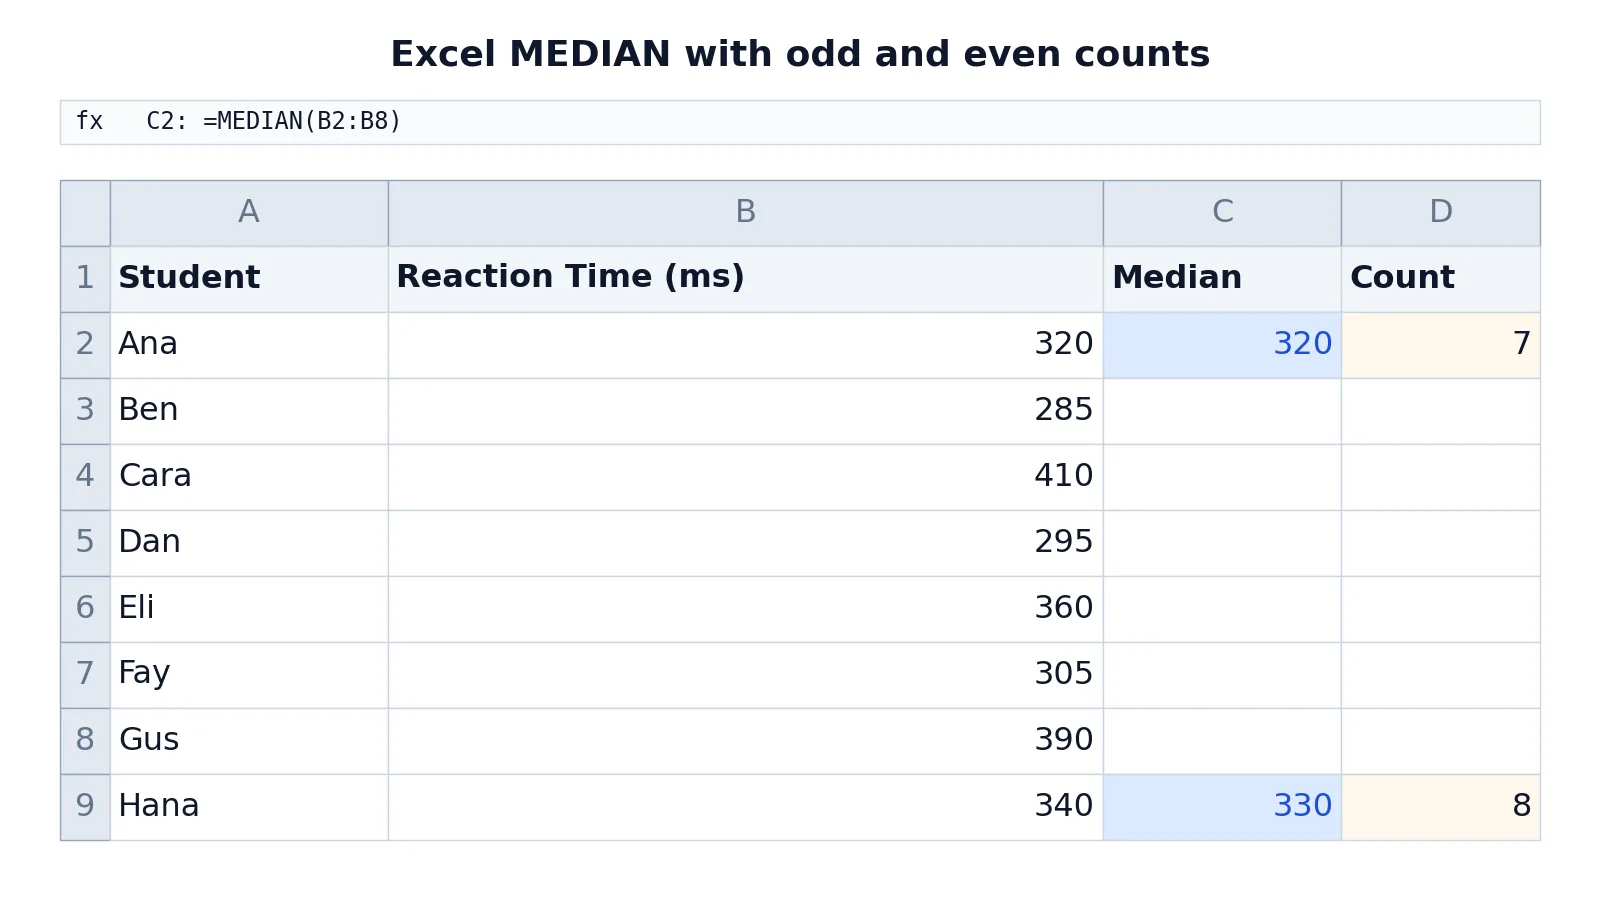
The table below holds reaction times in milliseconds for a group of students. Column B holds the values, and column C holds the median formula.
| Row | A | B | C | D |
|---|---|---|---|---|
| 1 | Student | Reaction Time (ms) | Median | Count |
| 2 | Ana | 320 | =MEDIAN(B2:B8) -> displays 320 | =COUNT(B2:B8) -> displays 7 |
| 3 | Ben | 285 | ||
| 4 | Cara | 410 | ||
| 5 | Dan | 295 | ||
| 6 | Eli | 360 | ||
| 7 | Fay | 305 | ||
| 8 | Gus | 390 | ||
| 9 | Hana | 340 | =MEDIAN(B2:B9) -> displays 330 | =COUNT(B2:B9) -> displays 8 |
With seven values, the count is odd. Excel sorts them to 285, 295, 305, 320, 360, 390, 410 and returns the fourth value, 320. The COUNT formula in D2 confirms there are 7 values.
Then Hana's time of 340 is added, making eight values. The count is now even, so Excel averages the two middle values. The sorted set is 285, 295, 305, 320, 340, 360, 390, 410. The two middle values are 320 and 340, and their average is 330. The COUNT formula in D9 confirms 8 values.
Notice that the median moved from 320 to 330 after adding a value above the old median. That is the expected behavior. The median tracks the center of the data, not the size of any single value.
Other Ways to Do It
The MEDIAN function is the standard approach, but a few alternatives exist.
Use the status bar. Select a range of numbers and Excel shows a summary in the status bar at the bottom of the window. Depending on your version and settings, this can include the average and count. It does not offer the median, so use the formula for that.
Use the function dialog. Select the Formulas tab, then AutoSum > More Functions, type MEDIAN, and select OK [2]. This walks you through the argument box if you prefer clicking to typing.
Use a calculator for a sanity check. If you want to verify a result by hand, the Mean, Median & Mode Calculator returns all three measures at once. It is useful when you are learning the concept and want to see how the median relates to the mean and mode.
Use sorting to see the middle value. Sorting the column puts the values in order so you can count to the middle yourself. See How to Sort a Column in Excel (Step by Step) for the steps. This is a good way to confirm a result, but it changes your sheet layout, so keep a copy if the original order matters.
Troubleshooting
The result is a #NUM! error. This happens when the range you pass contains no numbers at all. Check that the cells actually hold numbers and not text that looks like a number.
The result is a #VALUE! error. An argument is an error value or text that cannot be translated into a number [4]. Look for stray text in the range or a broken reference.
The result looks wrong. Check the range. A common cause is selecting one row too few or one row too many, which changes the count and therefore the middle position.
Blank cells are ignored. Excel skips empty cells inside a referenced range [4]. If you expected a blank to count as zero, it will not. Cells that contain the value zero are included [4].
Text in the range is ignored. Text values inside a reference do not affect the result [4]. If your column mixes labels with numbers, the labels drop out of the calculation.
Common Mistakes
- Selecting the header row. If you include a text header in the range, Excel ignores it, but the range is now confusing to read. Fix: select only the numeric cells, such as
B2:B8. - Confusing the median with the mean. They are different measures and give different answers on skewed data [1]. Fix: decide which measure answers your question before you write the formula.
- Assuming an even count gives a value from the data. With an even count, the median is the average of the two middle numbers, so it may not appear in your dataset at all [1]. Fix: expect a value between the two middle entries.
- Typing numbers directly into the argument list. Logical values and text representations of numbers typed directly into the list are counted [1]. Fix: reference a clean range instead of typing values one by one.
- Forgetting that zeros count. Empty cells are ignored, but cells with the value zero are included [4]. Fix: decide whether a zero is a real measurement or a missing value before you calculate.
- Editing the source data without rechecking the formula. The median updates automatically when values change. Fix: re-read the result after any edit to the range.
Limitations
The median describes the center of a set of numbers. It says nothing about how spread out those numbers are. Two datasets can share the same median while having very different ranges. To describe spread, pair the median with a measure such as the standard deviation, covered in How to Calculate Standard Deviation in Excel, or the variance, covered in How to Calculate Variance in Excel (Step by Step).
The median also hides the shape of the distribution. A dataset with two clusters of values can produce a median that sits in an empty gap between them. In that case the median is technically correct but describes no actual observation. When the shape matters, look at the full distribution. If your data is grouped into bins, How to Find the Median from a Histogram (Step by Step) shows how to estimate it from grouped counts.
Frequently Asked Questions
What is the Excel formula for median?
The formula is =MEDIAN(range), for example =MEDIAN(B2:B8). The function returns the middle number of the set, or the average of the two middle numbers when the count is even [1]. You can pass up to 255 numbers, and each argument can be a number, a name, an array, or a reference [1].
How do I find the median in Excel with an even number of values?
Excel handles this automatically. When the set has an even count, MEDIAN calculates the average of the two numbers in the middle [1]. You do not need a separate formula or a manual step. Just point the function at the full range and read the result.
Why does my MEDIAN formula return a different value than I expected?
The most common cause is a range that includes the wrong cells, which changes the count and shifts the middle position. Another cause is blank cells, which Excel ignores inside a referenced range [4]. Check the range boundaries first, then check for empty or text cells inside it.
Does MEDIAN ignore blank cells and text?
Yes. If a range or cell reference argument contains text, logical values, or empty cells, those values are ignored [4]. Cells with the value zero are included [4]. This is why a column with a few blanks still returns a sensible median, but a column with zeros may return a lower value than you expect.
Can I use MEDIAN with a condition, like only values above a threshold?
Not directly. MEDIAN takes numbers and references, not criteria. To get a conditional median, filter the data first or build a helper column that returns the value when your condition is met and a blank otherwise, then run MEDIAN on that helper column. For related conditional logic in Excel, see How to Calculate P Value in Excel (Step by Step) for another example of combining functions to answer a specific question.
References
- MEDIAN function | Microsoft Support
- Calculate the median of a group of numbers | Microsoft Support
- Calculate the average of a group of numbers | Microsoft Support
- AVERAGE function | Microsoft Support
Further Reading
- Broman KW, Woo KH (2018). Data Organization in Spreadsheets. The American Statistician
- Ziemann M, Eren Y, El-Osta A (2016). Gene name errors are widespread in the scientific literature. Genome Biology