Formula for Range: Definition, Formula and Examples
By Dr. Zubair Khalid, DVM, MS, PhD ·
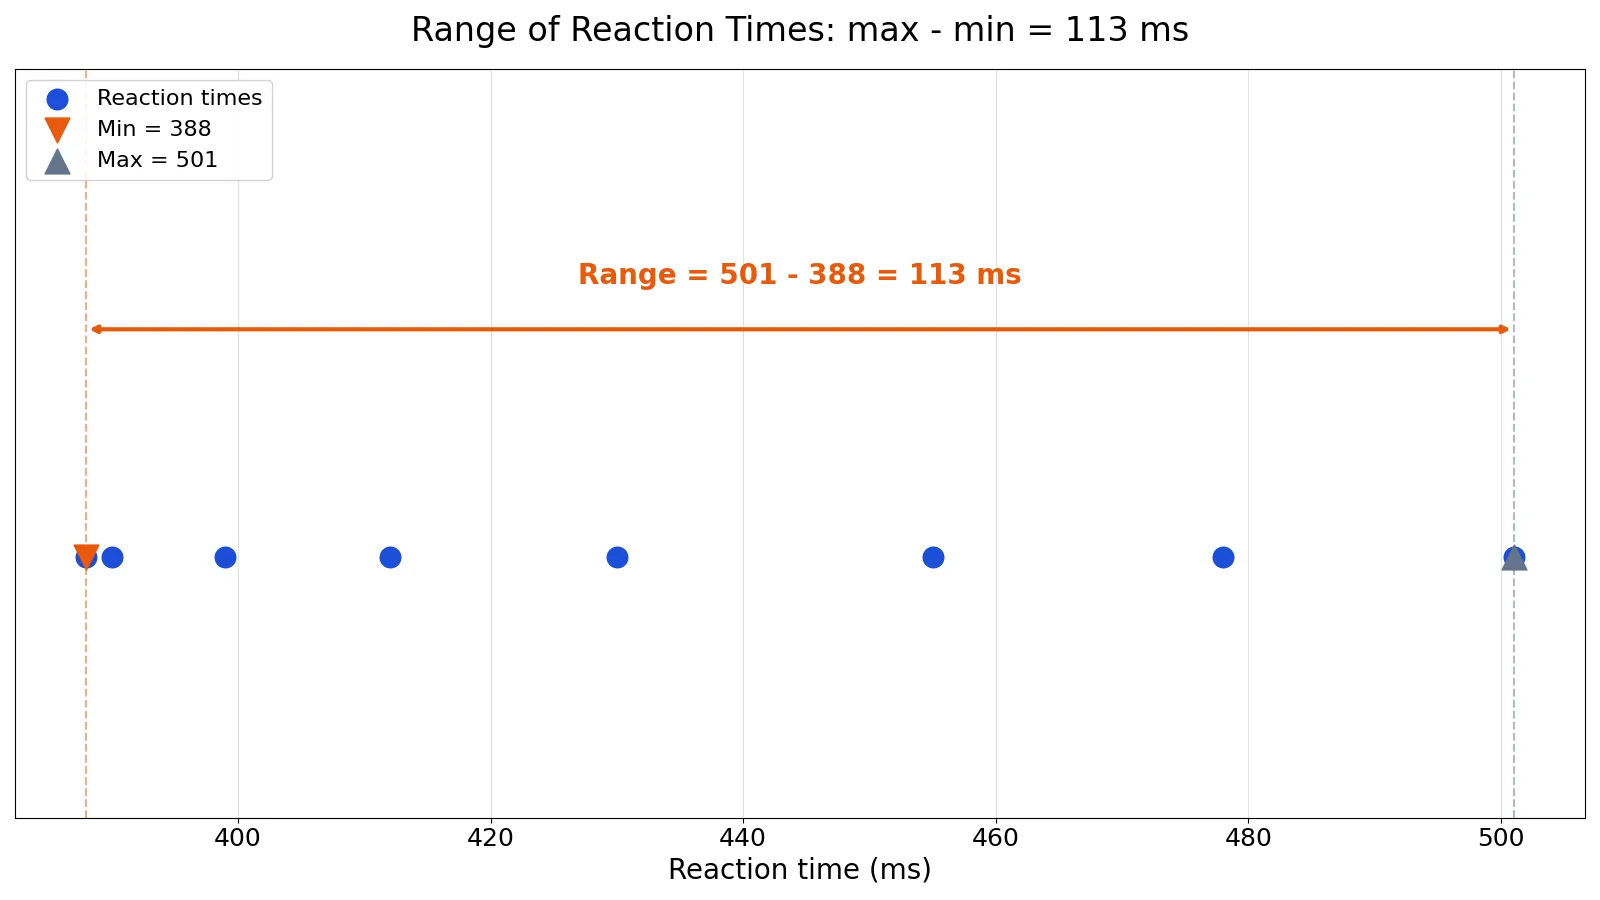
The formula for range is simple: subtract the smallest value in a data set from the largest value. It tells you how wide the spread of your data is in the same units as the original measurements. For the eight reaction times below, the range is 113 ms.
Quick Answer
- The formula for range is $\text{Range} = \text{max} - \text{min}$.
- Max is the largest value in the data set, min is the smallest.
- The range uses only two numbers, so it ignores everything in between.
- It is reported in the same units as the data (ms, kg, dollars, and so on).
- In Excel, the formula is
=MAX(range)-MIN(range).
The Formula
$$\text{Range} = \text{max} - \text{min}$$
Each symbol means the following:
| Symbol | Meaning |
|---|---|
| $\text{max}$ | The largest value in the data set |
| $\text{min}$ | The smallest value in the data set |
| $\text{Range}$ | The difference between them, in the original units |
A related formula appears when you work with grouped data or frequency tables. There, the range is often written as the upper class limit of the last class minus the lower class limit of the first class. The idea is the same. You are measuring the distance from the bottom of the data to the top.
The range is one of the simplest measures of dispersion. The statistical range guide covers how it fits alongside variance and standard deviation.
How to Calculate It Step by Step
- Write down every value in the data set.
- Scan the list and identify the smallest value. That is the min.
- Scan the list again and identify the largest value. That is the max.
- Subtract the min from the max.
- Report the result with the units of the original data.
For small data sets you can do this by eye. For larger ones, sort the values or use software. Sorting makes the min and max the first and last entries, which removes the chance of missing an extreme value.
Worked Example
The data set is eight reaction times in milliseconds from a simple reaction-time task.
| Trial | reaction_time_ms |
|---|---|
| 1 | 412 |
| 2 | 388 |
| 3 | 501 |
| 4 | 455 |
| 5 | 390 |
| 6 | 478 |
| 7 | 430 |
| 8 | 399 |
The steps are:
- Data: [412, 388, 501, 455, 390, 478, 430, 399]
- Minimum: 388
- Maximum: 501
- Formula: Range = max - min
- Substitute: Range = 501 - 388
- Result: Range = 113 ms
The fastest response was 388 ms and the slowest was 501 ms. The spread between them is 113 ms. If you want a quick sense of the typical value as well, the sample mean of these eight times gives you the center of the data.
How to Interpret the Result
A range of 113 ms means the entire set of reaction times fits inside a 113 ms window. Nothing in the data falls outside that window, by definition.
A small range means the values cluster tightly. A large range means at least one value sits far from the others. In reaction-time research, a range of 113 ms on a task with a mean near 430 ms suggests noticeable trial-to-trial variation, which is normal for human response times.
The range is easy to compare across groups. If one group has a range of 113 ms and another has a range of 40 ms, the second group is more consistent, at least at the extremes. That comparison is valid only when both groups are measured in the same units and under similar conditions.
The range is also the basis for a rough estimate of the standard deviation. The range rule of thumb divides the range by 4 to approximate the standard deviation for roughly bell-shaped data.
Doing It in Software
Excel has dedicated functions for the two endpoints. If your eight values sit in cells A1 through A8, the formula is:
=MAX(A1:A8)-MIN(A1:A8)The result is 113.
In Python with NumPy, the same calculation uses the max and min methods on the array:
import numpy as np
times = np.array([412, 388, 501, 455, 390, 478, 430, 399])
rng = times.max() - times.min()
print(rng)  # 113
Output:
113In R, the built-in range() function returns both endpoints, and diff() gives their difference:
times <- c(412, 388, 501, 455, 390, 478, 430, 399)
diff(range(times))  # 113
All three approaches give the same answer because they all compute max minus min. The choice depends on where your data already lives.
Common Mistakes
- Subtracting in the wrong order. Range = max - min, never min - max. Reversing the order gives a negative number, which is not a valid range. Fix: always put the larger value first.
- Using the range as a measure of average spread. The range depends on only two values. One outlier can double it. Fix: report the standard deviation or interquartile range alongside the range when you describe spread.
- Forgetting the units. A range of 113 is meaningless without knowing it is 113 ms. Fix: carry the units through every step and into the final answer.
- Confusing range with midrange. The midrange is the average of max and min, not their difference. Fix: check whether the question asks for the spread or the center.
- Ignoring outliers before computing. A single data-entry error can become the max and inflate the range. Fix: plot the data or check the extremes before you trust the result.
- Mixing units in one column. If some times are in seconds and others in milliseconds, the max and min are not comparable. Fix: convert everything to one unit first.
Limitations
The range uses two data points and discards the rest. Two data sets can have identical ranges and completely different shapes. One might be tightly packed with a single distant value, the other evenly spread. The range cannot tell them apart. It is also highly sensitive to outliers, since a single extreme value defines one of its endpoints. Adding one unusually large observation can change the range dramatically while leaving the mean and median almost untouched.
Because of this, the range works best as a first look at spread or as a companion to other measures. For skewed data or data with outliers, the interquartile range is usually more informative. For symmetric data, the standard deviation describes spread more completely. Use the range when you need a fast, transparent number that anyone can verify by eye.
Frequently Asked Questions
What is the formula for range in statistics?
The formula is $\text{Range} = \text{max} - \text{min}$, where max is the largest value and min is the smallest. Subtract the minimum from the maximum and report the result in the original units. It is the simplest measure of dispersion and requires no calculation beyond one subtraction.
Can the range be zero?
Yes. If every value in the data set is identical, the max equals the min and the range is zero. A range of zero means there is no variation at all in the observed values. This happens with constant measurements or with a data set that has only one distinct value.
Is the range affected by outliers?
Yes, heavily. Because the range depends entirely on the two most extreme values, a single outlier becomes either the max or the min and directly changes the result. This is the main weakness of the range compared with the interquartile range, which trims the extremes before measuring spread.
What is the difference between range and standard deviation?
The range measures the total distance between the largest and smallest values. The standard deviation measures how far values typically sit from the mean. The range is faster to compute and easier to explain. The standard deviation uses every value and is less sensitive to a single extreme observation.
How do I find the range in Excel?
Use =MAX(range)-MIN(range), replacing range with your cell range, such as A1:A8. Excel returns the difference between the largest and smallest values in that range. The same two functions work in Google Sheets. If your data contains blank cells, both functions ignore them.
References
This article draws on the standard references listed under Further Reading.
Further Reading
- NIST/SEMATECH e-Handbook of Statistical Methods
- OpenStax. Introductory Statistics 2e
- Krzywinski M, Altman N (2013). Importance of being uncertain. Nature Methods
- Krzywinski M, Altman N (2013). Significance, P values and t-tests. Nature Methods
- Wasserstein RL, Lazar NA (2016). The ASA Statement on p -Values: Context, Process, and Purpose. The American Statistician
- Greenland S, Senn SJ, Rothman KJ et al. (2016). Statistical tests, P values, confidence intervals, and power: a guide to misinterpretations. European Journal of Epidemiology
Related Articles
- Range Rule of Thumb: Definition, Formula and Examples
- Combinations Formula: Definition and Examples
- t Statistic Formula: Definition, Calculation and Examples
- Sample Mean: Definition, Formula and Examples
- Covariance Formula: Definition and Calculation Examples
- Statistical Range: Definition, Calculation, and Applications