What Is an Ordinal Scale? Definition and Examples
By Dr. Zubair Khalid, DVM, MS, PhD ·
Ordinal data is data whose categories have a meaningful order but unknown distances between them. The ordinal definition in statistics is simple: you can say one value is higher or lower than another, but you cannot say by how much. This article explains what ordinal data is, which statistics are appropriate, and how to analyze a real survey.
Quick Answer
- Ordinal data has ordered categories, but the gaps between categories are not equal or known.
- You can rank values, so median, mode, percentiles, and frequency counts are valid.
- The mean and standard deviation are usually not appropriate because they assume equal spacing.
- Nonparametric tests such as Mann-Whitney U, Wilcoxon signed-rank, and Kruskal-Wallis are built for ordinal data.
- A 1-5 Likert satisfaction scale is the classic example: 4 is better than 3, but "4 minus 3" has no fixed meaning.
What an Ordinal Scale Means
An ordinal scale is a measurement scale that puts items in order. The word comes from "order," and that is the whole idea. If you can sort the values from lowest to highest in a way that everyone agrees on, you have an ordinal scale.
The precise statistical definition is this: an ordinal scale is a level of measurement in which the values have a defined rank order, but the intervals between consecutive values are not guaranteed to be equal and arithmetic on the values is not meaningful. This places it above a nominal scale, which has no order at all, and below an interval scale, which has equal spacing. You can read more about how these levels compare in levels of measurement: nominal, ordinal, interval and ratio.
Common examples of ordinal scales include:
- Likert survey items (strongly disagree to strongly agree)
- Education level (high school, bachelor's, master's, doctorate)
- Customer satisfaction ratings (1 to 5 stars)
- Pain scales (mild, moderate, severe)
- Race finishing positions (1st, 2nd, 3rd)
In each case the order is real. The distance is not. The gap between "mild" and "moderate" pain is not the same size as the gap between "moderate" and "severe," and nobody can prove that it is.
How It Works
Ordinal data works through ranking. Instead of adding values, you compare their positions. The core operations are counting how often each category appears and finding the middle of the ordered list.
The median is the central value of the sorted data. For an even number of observations $n$, it is the average of the two middle values:
$$\text{Median} = \frac{x_{(n/2)} + x_{(n/2 + 1)}}{2}$$
where $x_{(1)} \le x_{(2)} \le \dots \le x_{(n)}$ are the sorted observations. The subscript in parentheses means "position in the sorted list," not multiplication.
The mode is the most frequent category:
$$\text{Mode} = \arg\max_k f_k$$
where $f_k$ is the frequency of category $k$. The symbol $\arg\max$ means "the category that gives the largest frequency."
Percentiles and quartiles also work on ordinal data because they only depend on position in the sorted list. The median is simply the 50th percentile [1].
The mean is different. It is defined as:
$$\bar{x} = \frac{1}{n}\sum_{i=1}^{n} x_i$$
This formula adds the values together, which assumes the numbers carry real quantity. On an ordinal scale, that assumption fails. Adding "satisfied" to "very satisfied" does not produce a meaningful number.
Worked Example
A company surveys 30 customers and asks them to rate satisfaction on a 1-5 Likert scale. The ratings are ordinal, so the goal is to describe the center with the median and mode.
| customer_id | satisfaction_rating |
|---|---|
| 1 | 5 |
| 2 | 4 |
| 3 | 4 |
| 4 | 3 |
| 5 | 5 |
| 6 | 4 |
| 7 | 2 |
| 8 | 4 |
| 9 | 5 |
| 10 | 4 |
| 11 | 3 |
| 12 | 4 |
| 13 | 5 |
| 14 | 4 |
| 15 | 4 |
| 16 | 3 |
| 17 | 5 |
| 18 | 4 |
| 19 | 4 |
| 20 | 2 |
| 21 | 5 |
| 22 | 4 |
| 23 | 3 |
| 24 | 4 |
| 25 | 5 |
| 26 | 4 |
| 27 | 4 |
| 28 | 3 |
| 29 | 4 |
| 30 | 5 |
The steps:
- Number of responses (n): 30
- Sum of ratings: 119
- Mean = 119 / 30 = 3.9667
- Sorted ratings, middle two for even n: 4 and 4
- Median = (4 + 4) / 2 = 4.0000
- Mode = most frequent rating: 4, which appears 15 times
- Sample SD (n-1): 0.8503
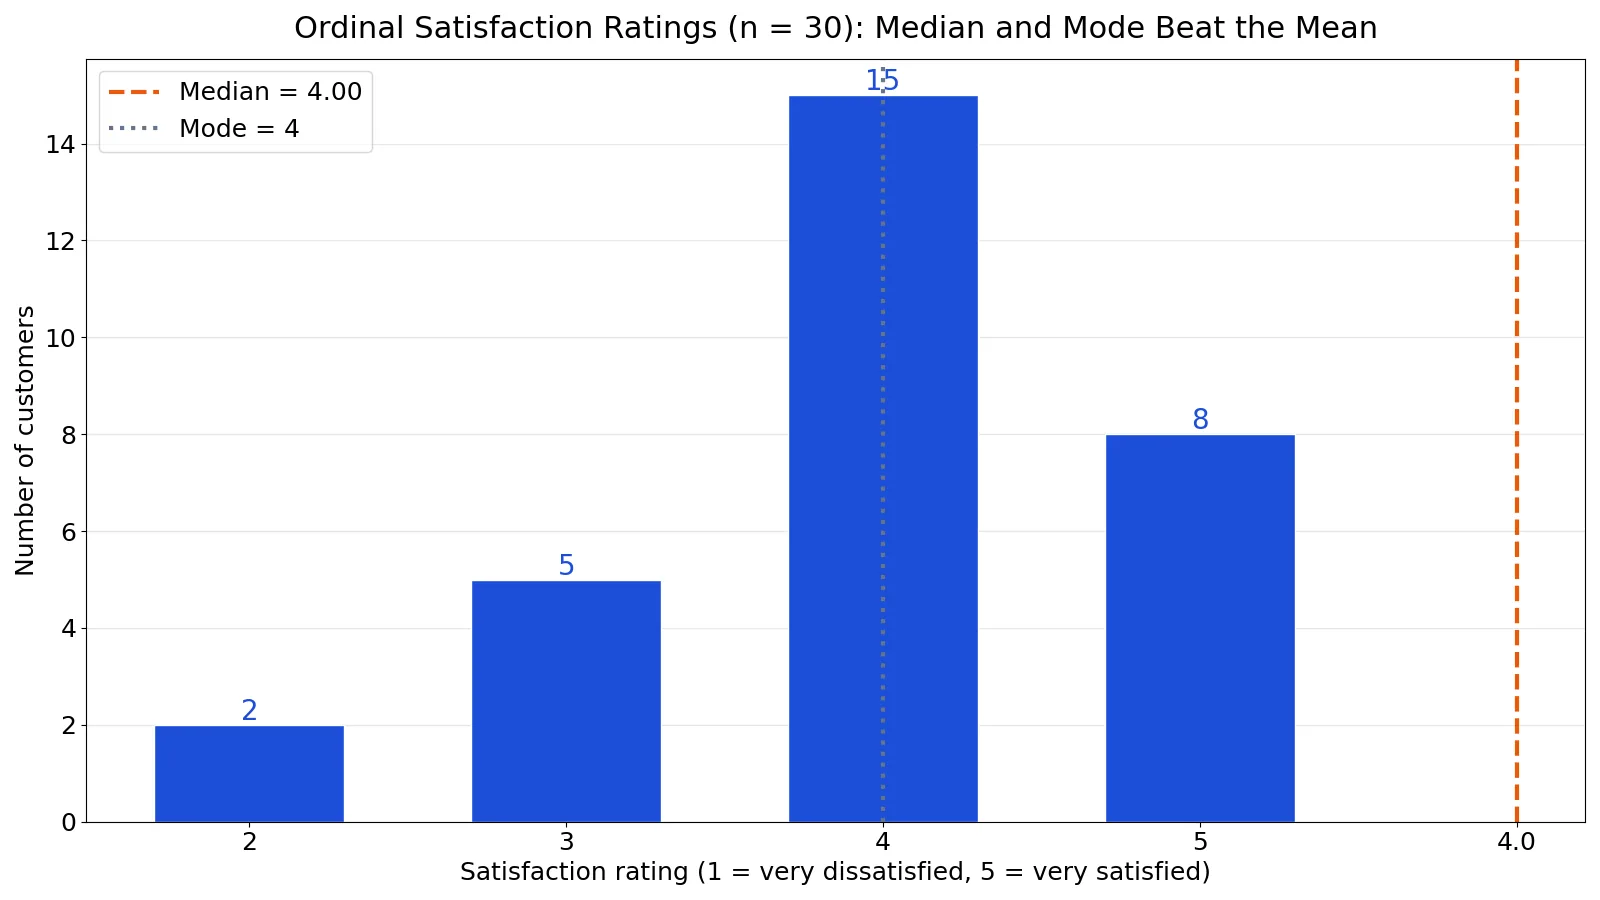
- Frequency table: 2 appears 2 times, 3 appears 5 times, 4 appears 15 times, 5 appears 8 times
Here is the code that produces these values:
import statistics
ratings = [5, 4, 4, 3, 5, 4, 2, 4, 5, 4, 3, 4, 5, 4, 4, 3, 5, 4, 4, 2, 5, 4, 3, 4, 5, 4, 4, 3, 4, 5]
mean = statistics.mean(ratings)      # 3.9667
median = statistics.median(ratings)  # 4.0000
mode = statistics.mode(ratings)      # 4
sd = statistics.stdev(ratings)       # 0.8503
from collections import Counter
freq = dict(sorted(Counter(ratings).items()))
print(f"mean={mean:.4f}, median={median:.4f}, mode={mode}, sample_sd={sd:.4f}, frequencies={freq}")
Output:
mean=3.9667, median=4.0000, mode=4, sample_sd=0.8503, frequencies={2: 2, 3: 5, 4: 15, 5: 8}The mean is reported here only to show the arithmetic. For ordinal data, the median of 4.00 and the mode of 4 are the numbers you would actually report. The frequency table tells the fuller story: half the sample gave a 4, and 23 of 30 customers gave a 4 or 5.
How to Interpret It
Start with the frequency table. It shows the shape of the responses without assuming equal spacing. In the example, ratings cluster at 4 and 5, with only 7 customers at 2 or 3.
Then report the median as the typical response. A median of 4.00 means that half the customers rated 4 or higher and half rated 4 or lower. That sentence is valid for ordinal data because it only uses order.
The mode adds context. A mode of 4 appearing 15 times out of 30 tells you the single most common answer, which is useful for product decisions.
Percentiles extend this. The 25th percentile and 75th percentile describe the spread of the middle half of the responses without pretending the scale is evenly spaced [1]. If you need to describe how common a category is, a proportion works well, and you can see how that is calculated in what is a proportion.
Avoid saying "the average customer was 3.97 satisfied." That sentence treats the scale as if it were a ruler. Say "the median rating was 4 out of 5" instead.
When to Use It (and when not to)
Use ordinal methods when:
- Your categories have a clear order but unknown spacing.
- You are working with Likert items, rankings, grades, or severity levels.
- Your sample is small and you cannot justify interval assumptions.
- You want to compare groups with nonparametric tests such as Mann-Whitney U or Kruskal-Wallis.
Do not use ordinal methods when:
- The categories have no order at all. That is nominal data, and you should use counts and chi-square tests.
- The scale has genuinely equal intervals and a true zero, such as height in centimeters or income in dollars. That is interval or ratio data, and means are appropriate. See types of data: nominal, ordinal, interval, ratio for the full breakdown.
- You need to model the outcome with linear regression on the raw values. Ordinal logistic regression is the better fit.
A common middle ground is to treat a summed multi-item Likert scale as interval. Many researchers do this, but it is a modeling choice, not a property of the scale. If you make it, state it.
Ordinal vs Interval
The closest related idea is interval data. Both have order. The difference is whether the distances between values are equal and meaningful.
| Feature | Ordinal | Interval |
|---|---|---|
| Order | Yes | Yes |
| Equal spacing | Not guaranteed | Yes |
| Meaningful differences | No | Yes |
| True zero | No | Usually no |
| Typical center | Median, mode | Mean |
| Example | Likert satisfaction | Temperature in Celsius |
A quick test: if you can subtract two values and the difference means something consistent, the scale is interval. If the difference is fuzzy, it is ordinal. The distinction matters because it decides whether you report a median or a mean.
Common Mistakes
- Reporting the mean as the headline number. The mean assumes equal spacing. Fix: report the median and mode, and show the frequency table.
- Treating Likert labels as numbers in arithmetic. "Strongly agree" is not 5 in a mathematical sense. Fix: rank the responses and use position-based statistics.
- Confusing ordinal with nominal. Nominal categories have no order, so a median is meaningless. Fix: check whether the categories can be sorted before choosing a statistic.
- Assuming equal gaps between scale points. The jump from 1 to 2 may not equal the jump from 4 to 5. Fix: avoid statements about "how much" higher one group is.
- Using a t-test on small ordinal samples without checking assumptions. Fix: use Mann-Whitney U or Wilcoxon signed-rank, which rely on ranks.
- Dropping the frequency table. A single summary number hides the distribution. Fix: always report counts per category alongside the median.
Limitations
Ordinal statistics cannot tell you the size of a difference. You can say group A ranked higher than group B, but not by how many units of satisfaction. This limits effect size reporting and makes some comparisons hard to communicate.
Ordinal methods also lose information when you collapse categories. Grouping a 5-point scale into "satisfied" and "not satisfied" makes the analysis simpler but discards the ranking detail. Nonparametric tests generally have less power than parametric tests when the interval assumption actually holds, so you may need a larger sample to detect the same effect. Finally, the median can be unstable when many responses pile up on one category, as with the mode of 4 in the example.
Frequently Asked Questions
What is the ordinal definition in statistics?
An ordinal scale is a measurement level where values have a meaningful rank order but the distances between them are not equal or known. You can say one value is higher than another, but not by how much. This makes median, mode, and percentiles appropriate and the mean questionable.
What statistics are appropriate for ordinal data?
Use the median, mode, frequency counts, and percentiles. For group comparisons, use nonparametric tests such as Mann-Whitney U, Wilcoxon signed-rank, Kruskal-Wallis, or Spearman correlation. These methods work on ranks, so they do not require equal spacing.
Can you calculate a mean for ordinal data?
You can compute the arithmetic, but the result is hard to interpret because it assumes equal intervals. Many analysts still report means for Likert scales by convention, especially when averaging several items. If you do, state the assumption clearly and report the median alongside it.
What is the difference between ordinal and nominal data?
Nominal data has categories with no order, such as eye color or country. Ordinal data has categories you can rank, such as education level or satisfaction. You can compute a median for ordinal data but not for nominal data. See what is ordinal data for more examples.
Is a 1-5 Likert scale ordinal or interval?
A single Likert item is generally treated as ordinal because the spacing between response options is not guaranteed to be equal. A sum or average of several Likert items is often treated as interval in practice. The choice depends on your analysis and should be justified. For help writing the items themselves, see ordinal survey questions.
References
Further Reading
- NIST/SEMATECH e-Handbook of Statistical Methods
- OpenStax. Introductory Statistics 2e
- Krzywinski M, Altman N (2013). Importance of being uncertain. Nature Methods
- Krzywinski M, Altman N (2013). Significance, P values and t-tests. Nature Methods
- Wasserstein RL, Lazar NA (2016). The ASA Statement on p -Values: Context, Process, and Purpose. The American Statistician