What Is a Data Map? Definition and Examples
By Dr. Zubair Khalid, DVM, MS, PhD ·
A data map is a document or catalog that records where each piece of data comes from, where it is stored, who owns it, and how it relates to other data. It answers the practical question "which system holds the real version of this field?" before you start an analysis. If you have ever pulled a number from the wrong spreadsheet, a data map is the artifact that prevents it.
Quick Answer
- A data map is an inventory of data sources plus the relationships between them, not a copy of the data itself.
- It typically lists each field or dataset, its system of record, its owner, its format, and how it can be accessed [1].
- It differs from a data dictionary, which describes fields inside one dataset, and from a data model, which describes structure for building systems.
- You build one by listing sources, tracing each field to a single system of record, and recording access rules and owners [1].
- It is most useful when data is spread across several systems and people keep asking where a number came from.
What a Data Map Means
In plain terms, a data map is a directory of your data. It says: this field lives here, this person owns it, this is how you request access, and this is what it feeds into. A university example describes its data map as a centralized tool that documents where key data is stored, who owns it, and how it can be accessed, covering areas such as enrollment data, grants, HR, and student milestones [1].
The precise definition is narrower. A data map is a structured set of mappings from data elements to their physical and organizational locations, expressed as source system, field name, data type, owner, access path, and downstream consumers. Each mapping is a claim you can verify. If the claim is wrong, the map is wrong, even if it looks complete.
Two properties matter. First, a data map is about location and lineage, not values. It tells you where the score column lives, not what the scores are. Second, it is about relationships. A field in a survey export may be derived from a field in a registration system, and the map records that link.
How It Works
A data map is built from mappings. For a single field you can write the relationship as:
$$ \text{field} \rightarrow (\text{source system},\ \text{owner},\ \text{type},\ \text{access rule}) $$
Each symbol carries a specific meaning:
- field is the named data element, such as
scoreorrespondent_id. - source system is the system of record, the one place treated as authoritative.
- owner is the person or unit accountable for the field's meaning and quality.
- type is the data type, such as integer, decimal, or date.
- access rule describes how someone obtains the data, including any approval step.
When you extend this to a whole dataset, the map becomes a table with one row per field. The count of rows equals the number of fields, and the count of distinct source systems tells you how fragmented the data is. A dataset with 4 fields drawn from 1 system is simple. The same 4 fields drawn from 4 systems means four access paths and four owners to coordinate.
Access rules are part of the mechanism, not an afterthought. In the university example, system access requests require approval from the data owner, a supervisor, or a compliance unit, and approval timelines vary by system, typically two to four weeks depending on training and compliance requirements [1]. A map that omits this step sends people down a dead end.
Worked Example
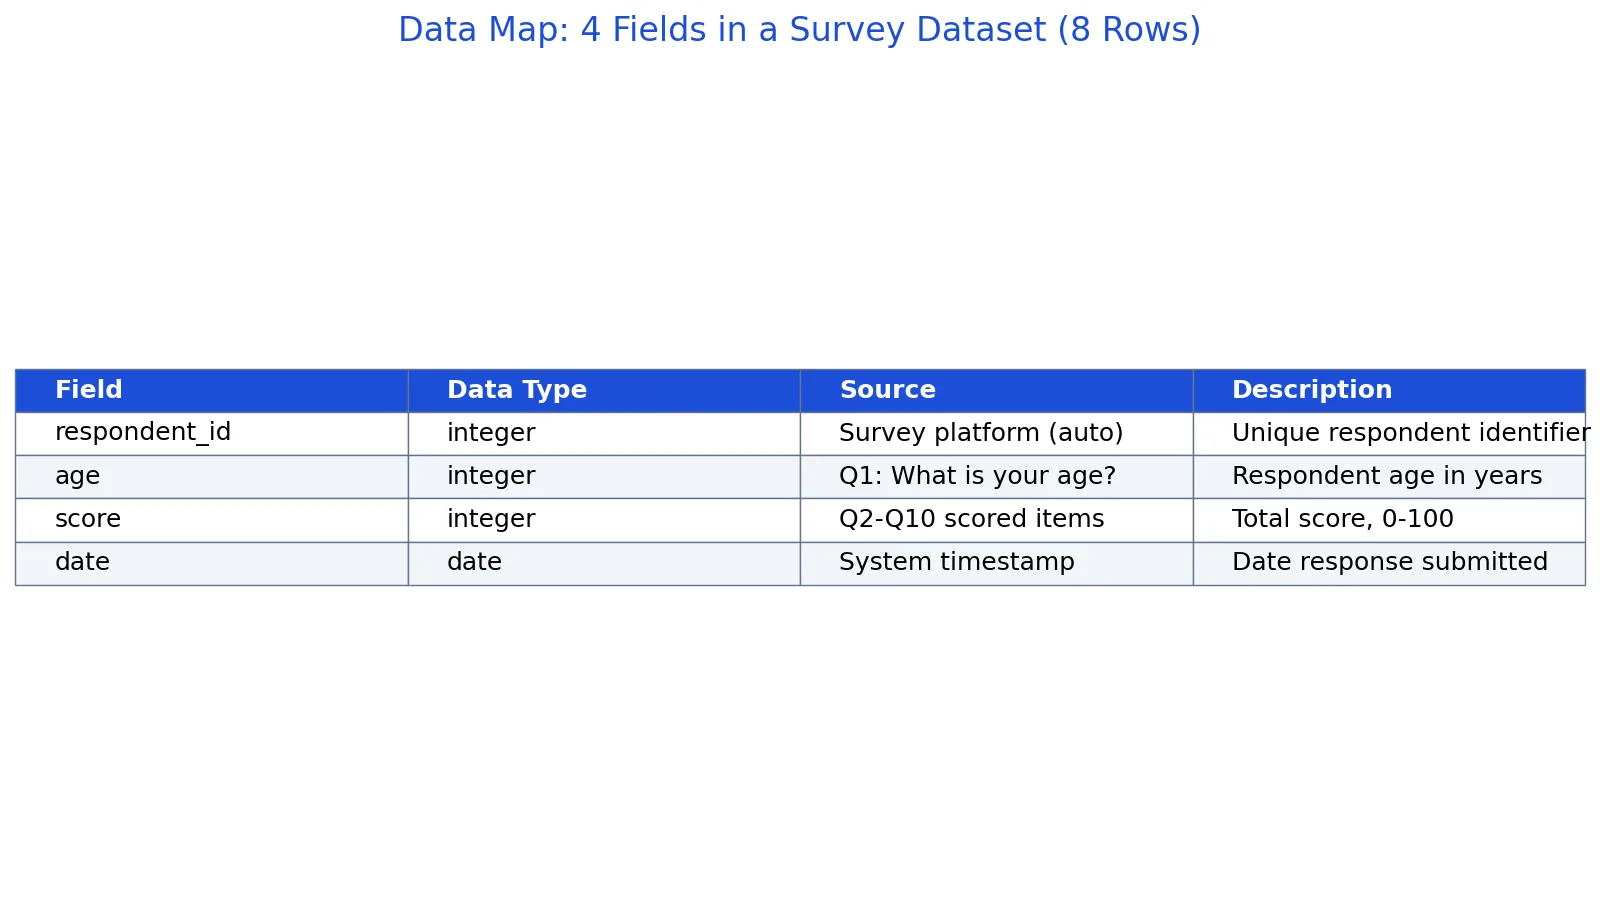
Take a small survey dataset with 8 respondents and 4 fields: respondent_id, age, score, and date. The table below is the raw data, and the data map is the second table that describes it.
| respondent_id | age | score | date |
|---|---|---|---|
| 1001 | 24 | 78 | 2024-01-05 |
| 1002 | 31 | 85 | 2024-01-06 |
| 1003 | 45 | 92 | 2024-01-07 |
| 1004 | 29 | 67 | 2024-01-08 |
| 1005 | 38 | 74 | 2024-01-09 |
| 1006 | 52 | 88 | 2024-01-10 |
| 1007 | 27 | 95 | 2024-01-11 |
| 1008 | 41 | 71 | 2024-01-12 |
The data map for this dataset has one row per field:
| Field | Data type | Source | Description |
|---|---|---|---|
| respondent_id | integer | Survey intake form | Unique identifier assigned at submission |
| age | integer | Survey intake form | Self-reported age in years at time of survey |
| score | decimal | Scoring service | Computed assessment score, 0 to 100 scale |
| date | date | Survey intake form | Date the response was submitted |
Now walk through the descriptive steps. Counting rows gives $n = 8$. Counting fields gives 4. The mean age is the sum of the age column divided by the number of rows:
$$ \bar{x}_{\text{age}} = \frac{287}{8} = 35.8750 $$
The mean score follows the same pattern:
$$ \bar{x}_{\text{score}} = \frac{650}{8} = 81.2500 $$
The sample standard deviation of the score uses the sum of squared deviations divided by $n-1$:
$$ s = \sqrt{\frac{735.5000}{7}} = 10.2504 $$
The score range is the maximum minus the minimum, $95 - 67 = 28$.
The code below reproduces these values.
import pandas as pd
df = pd.DataFrame({
    'respondent_id': [1001,1002,1003,1004,1005,1006,1007,1008],
    'age': [24,31,45,29,38,52,27,41],
    'score': [78,85,92,67,74,88,95,71],
    'date': ['2024-01-05','2024-01-06','2024-01-07','2024-01-08',
             '2024-01-09','2024-01-10','2024-01-11','2024-01-12'],
})
print(f"score mean = {df['score'].mean():.4f}; score sample SD = {df['score'].std():.4f}; "
      f"age mean = {df['age'].mean():.4f}; fields = {df.shape[1]}; rows = {len(df)}")  # std() uses ddof=1
Output:
score mean = 81.2500; score sample SD = 10.2504; age mean = 35.8750; fields = 4; rows = 8The map and the statistics work together. The map tells you that score comes from a scoring service while age comes from the intake form, so if the score distribution looks odd you know which team to ask. The statistics tell you the score column has a mean of 81.2500 and a sample standard deviation of 10.2504, which is the kind of summary you would attach to the map as a data quality note.
How to Interpret It
Read a data map as a set of claims about location and ownership, then test the claims that matter most. Start with the fields you use most often. For each one, confirm that the listed source is genuinely the system of record and that the owner still holds that role.
Look for fields with more than one plausible source. Those are the ones that produce conflicting numbers in reports. A map that assigns each field exactly one system of record has done its main job.
Check the access column against reality. If the map says a field is available through a self-service export but the actual process requires a two to four week approval, the map is misleading even though the source is correct [1].
Finally, treat the map as versioned. Fields get renamed, systems get replaced, and owners change roles. A map without a review date is a snapshot of the past.
When to Use It (and when not to)
Use a data map when data is spread across multiple systems and people repeatedly ask where a number comes from. It pays off when onboarding new analysts, when writing a report that combines sources, and when you need to request access and want to know who to ask [1]. It also helps when you are defining a dataset for a project and need to know which fields are available and from where.
Skip it when you have a single source and a single owner. A one-row map adds paperwork without adding information. Skip it too when you need field-level definitions inside one table, since that is a data dictionary's job. And do not use a data map as a substitute for a data model if you are designing how systems will store and relate records.
Data Map vs Data Dictionary
These two artifacts are often confused because both are tables about fields. The difference is scope.
| Aspect | Data map | Data dictionary |
|---|---|---|
| Scope | Across systems and datasets | Within one dataset or table |
| Primary question | Where does this data live and who owns it? | What does this field mean and what values can it take? |
| Typical columns | Field, source system, owner, access rule | Field, type, allowed values, definition |
| Main audience | Analysts, data stewards, requesters | Analysts, developers, report authors |
| Changes when | Systems or ownership change | Definitions or formats change |
A data map can point you to a dataset, and the dictionary for that dataset explains the fields. You often need both. If you are working with a single well-defined table, a dictionary alone may be enough. If you are tracing a metric across several systems, the map is the starting point.
Common Mistakes
- Listing every copy of a field instead of the system of record. Fix this by naming exactly one authoritative source per field and marking the rest as copies or derived views.
- Leaving out the access path. A map that says where data lives but not how to get it forces people to guess. Record the request route and any approval step [1].
- Recording owners as team names with no person attached. Teams reorganize. Attach a role and a named contact, and review both.
- Treating the map as static. Fields and systems change. Add a last-reviewed date and a review cadence.
- Confusing the map with the data. The map describes location and lineage. It should not contain the actual values, which would create a second copy to maintain.
- Skipping the relationships. A flat list of fields misses the point. Note which fields feed which downstream reports or derived columns.
Limitations
A data map cannot tell you whether the data is correct. It records where a field lives and who owns it, but a field can be accurately mapped and still contain errors, duplicates, or stale values. Quality checks are a separate activity, and the map only helps you find the right place to run them.
A data map also goes out of date faster than most documentation. Systems are replaced, fields are renamed, and owners change roles, so any map without a review date should be treated as a historical record. Finally, a map is only as good as the access it describes. If approval timelines vary by system and depend on training and compliance requirements, the map can tell you the route but not how long the trip will take [1].
Frequently Asked Questions
What is a data map in simple terms?
It is a directory of your data. For each field or dataset it records where the data is stored, who owns it, what type it is, and how you get access. Think of it as an address book for data rather than a copy of the data itself.
How is a data map different from a data catalog?
The terms overlap heavily. A data catalog is usually a software tool that holds metadata, and a data map is the content inside it. In practice, many teams use the words interchangeably, and the important part is that both record sources, owners, and access paths.
Who should maintain a data map?
The data owner for each field supplies the definition and approves access, while a data steward or IT team maintains the map itself. In the university example, change requests go through a service desk and are reviewed within five to ten business days [1]. Assign one maintainer so updates do not stall.
How often should a data map be updated?
Update it whenever a source system, field name, or owner changes, and review the whole map on a fixed schedule such as twice a year. A map with no review date is a snapshot, and readers cannot tell how stale it is.
Can I build a data map from a single spreadsheet?
Yes, if that spreadsheet is your only source. List each column, its type, its owner, and how someone gets a copy. The map stays useful as long as the sheet is the system of record. Once a second system enters the picture, expand the map to cover both and mark which one is authoritative.
If you are new to the underlying concepts, start with what data is and what data analysis is, then look at structured data and quantitative data examples to see how field types and value ranges shape what a map should record. When you are ready to summarize the fields you have mapped, data aggregation shows how to roll them up without losing the source trail.
References
Further Reading
- Wilson G, Bryan J, Cranston K et al. (2017). Good enough practices in scientific computing. PLOS Computational Biology
- Wilkinson MD, Dumontier M, Aalbersberg IJ et al. (2016). The FAIR Guiding Principles for scientific data management and stewardship. Scientific Data
- NIST/SEMATECH e-Handbook of Statistical Methods
- Broman KW, Woo KH (2018). Data Organization in Spreadsheets. The American Statistician
- Wilson G, Aruliah DA, Brown CT et al. (2014). Best Practices for Scientific Computing. PLoS Biology