What Is a Dataset? Definition, Types and Examples
By Dr. Zubair Khalid, DVM, MS, PhD ·
A data set is a collection of related data organized for analysis or another purpose, usually in rows and columns or another structured format [1]. Each column typically represents one variable, and each row represents one observation or record [2]. This article explains the definition, the common formats you will meet, and how rows and columns fit together.
Quick Answer
- A data set is a collection of related data organized for analysis or some other purpose, often in rows and columns [1].
- In tabular data, each column is a variable and each row is a value or record [2].
- Common formats include spreadsheets, databases, CSV files, JSON and collections of text files or images [1].
- Some data sets are non-tabular, meaning they do not fit the traditional row-column format [2].
- The structure of a data set describes what is observed, how often, and how it is organized [3].
What a Data Set Means
In plain terms, a data set is a bundle of related data that someone has organized so it can be stored, shared and analyzed [1]. A spreadsheet of survey responses is a data set. So is a folder of labeled images, or a table of stock prices for one company over many years.
The precise definition adds two conditions. First, the data must be related, meaning the records describe the same kind of thing. Second, the data must be organized in a specific way that makes it easy to access and use [1]. A pile of unrelated numbers is not a data set. A table where every row describes one survey respondent is.
Data sets are used for research, statistical analysis, training machine learning models and data visualization [1]. Public repositories host thousands of them. The UCI Machine Learning Repository, for example, maintains 689 data sets as a service to the machine learning community [4], including the classic iris data set from Fisher, 1936, one of the earliest known data sets used for evaluating classification methods [4][5].
How It Works
The mechanism behind a tabular data set is simple. You have a grid. Columns hold variables, rows hold observations, and cells hold values.
For a data set with $n$ rows and $p$ columns, the shape is written as a pair:
$$\text{shape} = (n, p)$$
where $n$ is the number of rows (observations) and $p$ is the number of columns (variables). A column mean is the sum of its values divided by the number of rows:
$$\bar{x} = \frac{1}{n}\sum_{i=1}^{n} x_i$$
where $x_i$ is the value in row $i$, and $n$ is the number of rows. Each column also has a data type, or dtype, which tells the software whether the values are numbers, text or something else. Numeric columns support arithmetic. Text columns, often stored as the object type, do not.
Worked Example
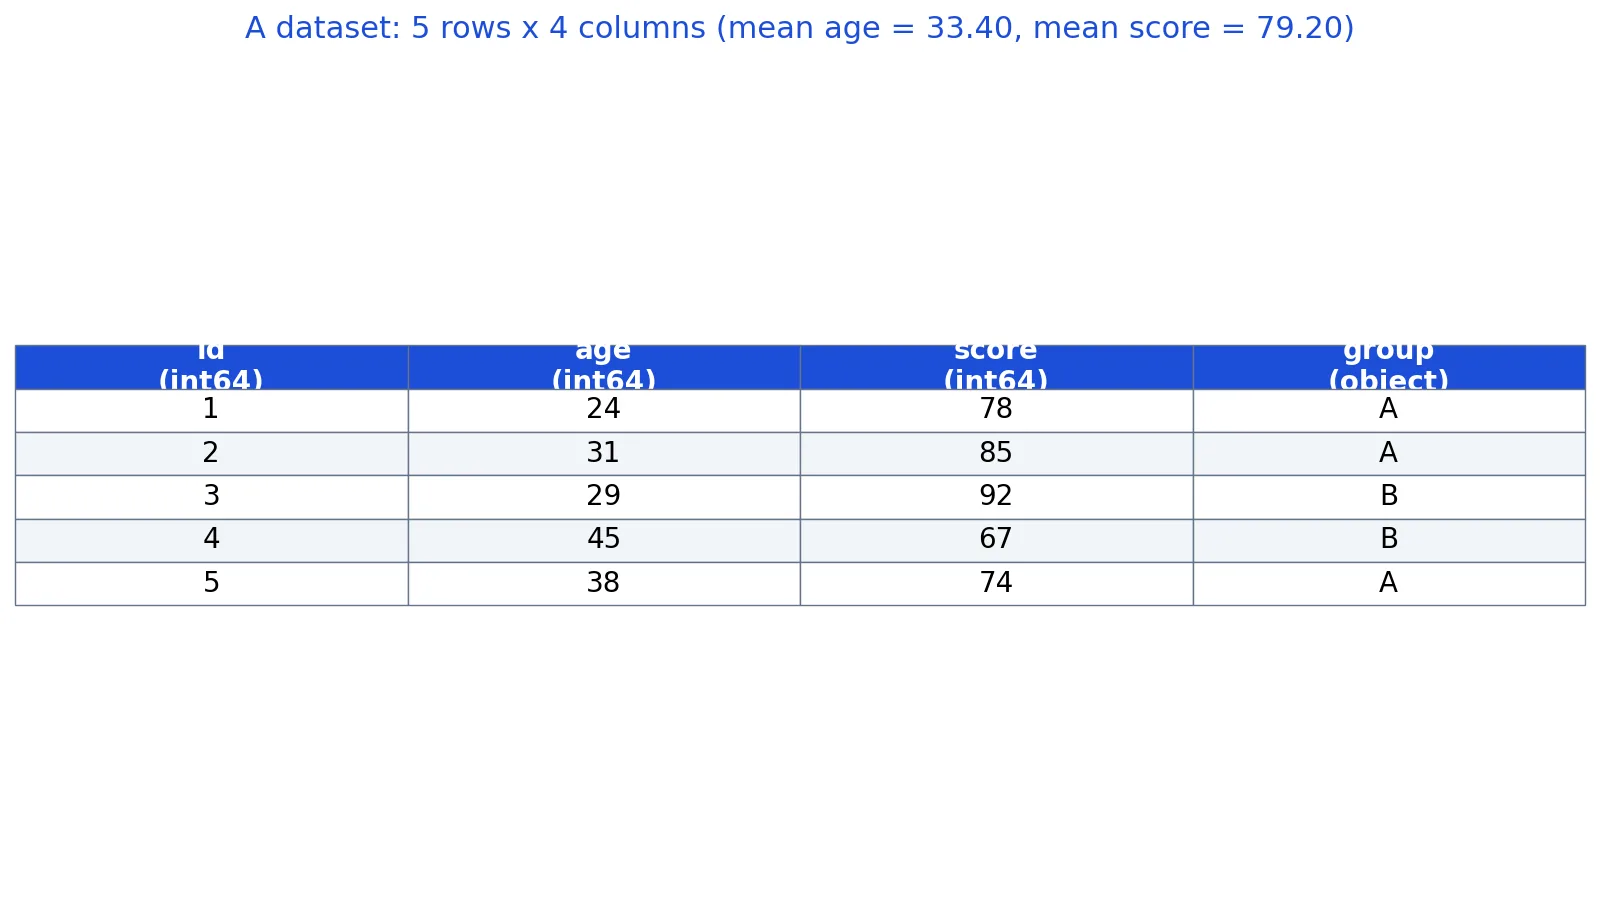
Take a tiny survey data set with 5 respondents. It has four columns: id, age, score and group.
| id | age | score | group |
|---|---|---|---|
| 1 | 24 | 78 | A |
| 2 | 31 | 85 | A |
| 3 | 29 | 92 | B |
| 4 | 45 | 67 | B |
| 5 | 38 | 74 | A |
Loading it into pandas and inspecting it gives the following steps and values.
- Load the CSV:
df = pd.read_csv('survey.csv')returns 5 rows by 4 columns. - Inspect the shape:
df.shapeis(5, 4). - List the column names:
['id', 'age', 'score', 'group']. - Check the dtypes: id, age and score are
int64, and group isobject. - Compute the mean age: $167/5 = 33.4000$.
- Compute the mean score: $396/5 = 79.2000$.
import pandas as pd
df = pd.read_csv('survey.csv')
print(df.shape)      # (5, 4)
print(df.dtypes)
print(df['age'].mean())   # 33.4000
print(df['score'].mean()) # 79.2000
Output:
shape=(5, 4), columns=['id', 'age', 'score', 'group'], mean_age=33.4000, mean_score=79.2000The shape tells you the size. The dtypes tell you which columns you can average. The means tell you the center of the two numeric columns.
How to Interpret It
Read the shape first. Five rows and four columns means five observations and four variables. That is a small cross-sectional data set, where each person appears once and no person appears twice [3]. With cross-sectional data you can look for differences between units, but not within them [3].
Read the dtypes second. Three integer columns and one text column means you can compute means for age and score but not for group. If you tried to average group, the software would either error or produce nonsense.
Read the values third. A mean age of 33.40 and a mean score of 79.20 describe the center of this sample only. With five rows, a single unusual value would move both numbers a lot. Small data sets are useful for learning the mechanics, not for drawing conclusions about a population.
When to Use It (and when not to)
Use a tabular data set when your observations are independent units measured on the same set of variables. Survey responses, sensor readings, transaction logs and test scores all fit this shape. Tabular data is also the natural input for most statistical tests and for many machine learning models.
Do not force tabular structure onto data that does not have it. Images, audio, free text and graphs are often stored as non-tabular data sets, meaning they do not fit the traditional row-column format [2]. You can still analyze them, but the tools and the mental model differ.
Also think about the structure of your data before you analyze it. Ask what is being observed, how often it is being observed, and how it is organized [3]. A data set that tracks the same people over many years supports different questions than one that samples each person once [3]. If you are new to analysis, cross-sectional data is the usual starting point because the techniques are the simplest [3].
Data Set vs Database
These two terms get mixed up often. A database is a system that stores and manages data. A data set is a collection of data within a database [2]. You can export a data set from a database as a CSV file and analyze it on your own machine.
| Feature | Data set | Database |
|---|---|---|
| What it is | A collection of related data organized for analysis [1] | A system that stores and manages data |
| Typical form | Table, CSV, JSON, files, images [1] | Tables with relationships and rules |
| Main use | Analysis, statistics, model training [1] | Storage, retrieval, transactions |
| Size | Any size, from 5 rows up | Usually large and persistent |
| Relationship | Can be a collection of data within a database [2] | Can contain many data sets |
If you want the storage side, see what a database is. If you want the analysis side, keep reading here.
Common Mistakes
- Treating the first row as data. In many CSV files the first row holds column names, not values. The fix is to check the header before you compute anything.
- Averaging a text column. Group labels and names are stored as text. The fix is to check dtypes first and only average numeric columns.
- Assuming every row is one person. Some data sets track the same unit many times. The fix is to check whether IDs repeat before you treat rows as independent [3].
- Mixing units in one column. A column with some values in pounds and some in kilograms will produce a meaningless mean. The fix is to standardize units before analysis.
- Ignoring missing values. A blank cell can silently drop a row from a calculation. The fix is to count missing values per column before you summarize.
- Confusing the data set with the tool. A CSV file is a format, not a data set. The fix is to describe the data set by its rows, columns and meaning.
Limitations
A data set only answers questions its variables can support. If you did not collect a variable, you cannot analyze it. Cross-sectional data cannot tell you how people change over time, because each unit appears once [3]. No amount of clever analysis fixes a missing column.
Data sets also carry the biases of how they were collected. A sample of 5 respondents, or 100, or 10,000, reflects whoever was measured. The mean age of 33.40 in the example describes those five people and nothing more. Always read the documentation that comes with a data set before you generalize from it.
Frequently Asked Questions
What is the difference between a data set and a dataset?
They are the same thing. The two-word form "data set" and the one-word form "dataset" both refer to a collection of related data organized for analysis [1]. Style guides differ on which to prefer, but the meaning does not change.
What are the most common data set formats?
Spreadsheets, databases, CSV files, JSON and collections of text files or images are all common [1]. CSV is popular because it is plain text and opens in almost anything. JSON is common for nested or web data. Spreadsheets are common for small, hand-edited tables.
How many rows and columns should a data set have?
There is no fixed rule. A data set can have 5 rows or 5 million. What matters is that the rows are observations of the same kind and the columns are variables measured on those observations [2]. The shape simply tells you how much data you have.
What does non-tabular mean?
Non-tabular means the data does not fit the traditional row-column format [2]. Images, audio clips and blocks of free text are typical examples. They are still data sets, but you analyze them with different tools.
Can a data set have more than one table?
Yes. Many data sets ship as several related tables, such as one table of people and another of their purchases. You join them on a shared key column. A single flat table is easier to start with, and you can build one from several tables when you need to.
If you want to see how different structures look in practice, browse dataset examples and types of data sets. For the storage layer underneath, read what structured data is, and for the values inside each column, see Python data types explained.
References
- Guide Home - Data Sets - Library at South College
- How to Analyze a Dataset: 6 Steps | HBS Online
- The Structure of a Dataset - Working with Quantitative Data - LibGuides at UCLA School of Law - Hugh & Hazel Darling Law Library
- UCI Machine Learning Repository
- UCI Machine Learning Repository
Further Reading
- Broman KW, Woo KH (2018). Data Organization in Spreadsheets. The American Statistician
- Catalog - Data.gov