What Is Data Analysis? Definition, Steps and Examples
By Dr. Zubair Khalid, DVM, MS, PhD ·
Data analysis is the process of cleaning, inspecting, transforming and modeling data so it becomes meaningful, useful information you can act on [1]. It sits between raw data and a decision: you start with numbers or text that mean little on their own, and you finish with a finding you can explain. This article gives you the definition, the steps, a worked example with real numbers, and the mistakes that trip people up.
Quick Answer
- Definition: Data analysis is the work of turning raw data into conclusions by cleaning it, exploring it, and applying statistical or qualitative methods [1].
- Core steps: Define the question, collect the data, clean it, explore it, analyze it, interpret the results, and communicate them [2].
- Two families: Quantitative analysis uses numbers and statistics, qualitative analysis uses text, themes and narratives [2].
- One number tells you little: You usually need a center (mean or median), a spread (standard deviation), and a trend to say anything useful.
- It is one part of a bigger pipeline: Data analysis is a single stage inside data analytics, which also covers collection, storage and reporting [1].
What Data Analysis Means
In plain language, data analysis is answering a question with evidence. You take a dataset, ask what it can tell you, and produce a defensible answer. The process focuses on cleaning, inspecting, transforming and modeling data so it can be turned into meaningful and useful information [1].
The precise definition is narrower. Data analysis is the application of statistical, mathematical or logical techniques to describe, summarize, and draw inferences from a dataset. Descriptive techniques reduce many values to a few summary numbers. Inferential techniques use a sample to make claims about a larger population, usually with a stated level of uncertainty.
That distinction matters because it separates two questions you will constantly face. "What happened in this data?" is descriptive. "What does this data imply about the world?" is inferential, and it needs assumptions you must state out loud.
How It Works
Most analysis rests on a small set of formulas. Here are the ones used in the example below.
The mean is the sum of all values divided by the count:
$$\bar{x} = \frac{1}{n}\sum_{i=1}^{n} x_i$$
- $\bar{x}$ is the sample mean.
- $n$ is the number of observations.
- $x_i$ is the $i$-th value.
- $\sum$ means "add up all of them."
The sample standard deviation measures spread, using $n-1$ in the denominator to correct for the fact that you are estimating from a sample:
$$s = \sqrt{\frac{1}{n-1}\sum_{i=1}^{n}(x_i - \bar{x})^2}$$
- $s$ is the sample standard deviation.
- $x_i - \bar{x}$ is how far each value sits from the mean.
- Squaring removes the sign, then the square root returns the units to the original scale.
A least-squares trend line fits the straight line that minimizes the sum of squared vertical distances from the points:
$$y = b_1 x + b_0$$
- $y$ is the predicted value.
- $x$ is the time index or predictor.
- $b_1$ is the slope, the change in $y$ per one-unit change in $x$.
- $b_0$ is the intercept, the predicted value when $x = 0$.
Different analysis approaches sequence these steps differently. Classical analysis imposes a model first, then analyzes. Exploratory data analysis looks at the data first and infers what model fits [3]. In practice, analysts mix both [3].
Worked Example
The dataset is monthly revenue in thousands of dollars for a small business over 12 months.
| Month | Revenue |
|---|---|
| Jan | 42.0 |
| Feb | 45.5 |
| Mar | 44.0 |
| Apr | 48.2 |
| May | 51.0 |
| Jun | 49.5 |
| Jul | 53.2 |
| Aug | 55.0 |
| Sep | 54.1 |
| Oct | 58.3 |
| Nov | 60.0 |
| Dec | 62.5 |
Step 1: Count the observations. $n = 12$.
Step 2: Sum the revenue. $\text{sum} = 623.30$.
Step 3: Compute the mean. $623.30 / 12 = 51.9417$. On average the business earned about 51.94 thousand dollars per month.
Step 4: Compute the median. Sort the values and take the middle. With 12 values there are two middle numbers, 51.00 and 53.20, so the median is $(51.00 + 53.20) / 2 = 52.1000$. The median sits slightly above the mean, which hints that a few lower months pull the average down.
Step 5: Compute the sample standard deviation. $s = 6.4434$. Monthly revenue typically deviates about 6.44 thousand dollars from the mean.
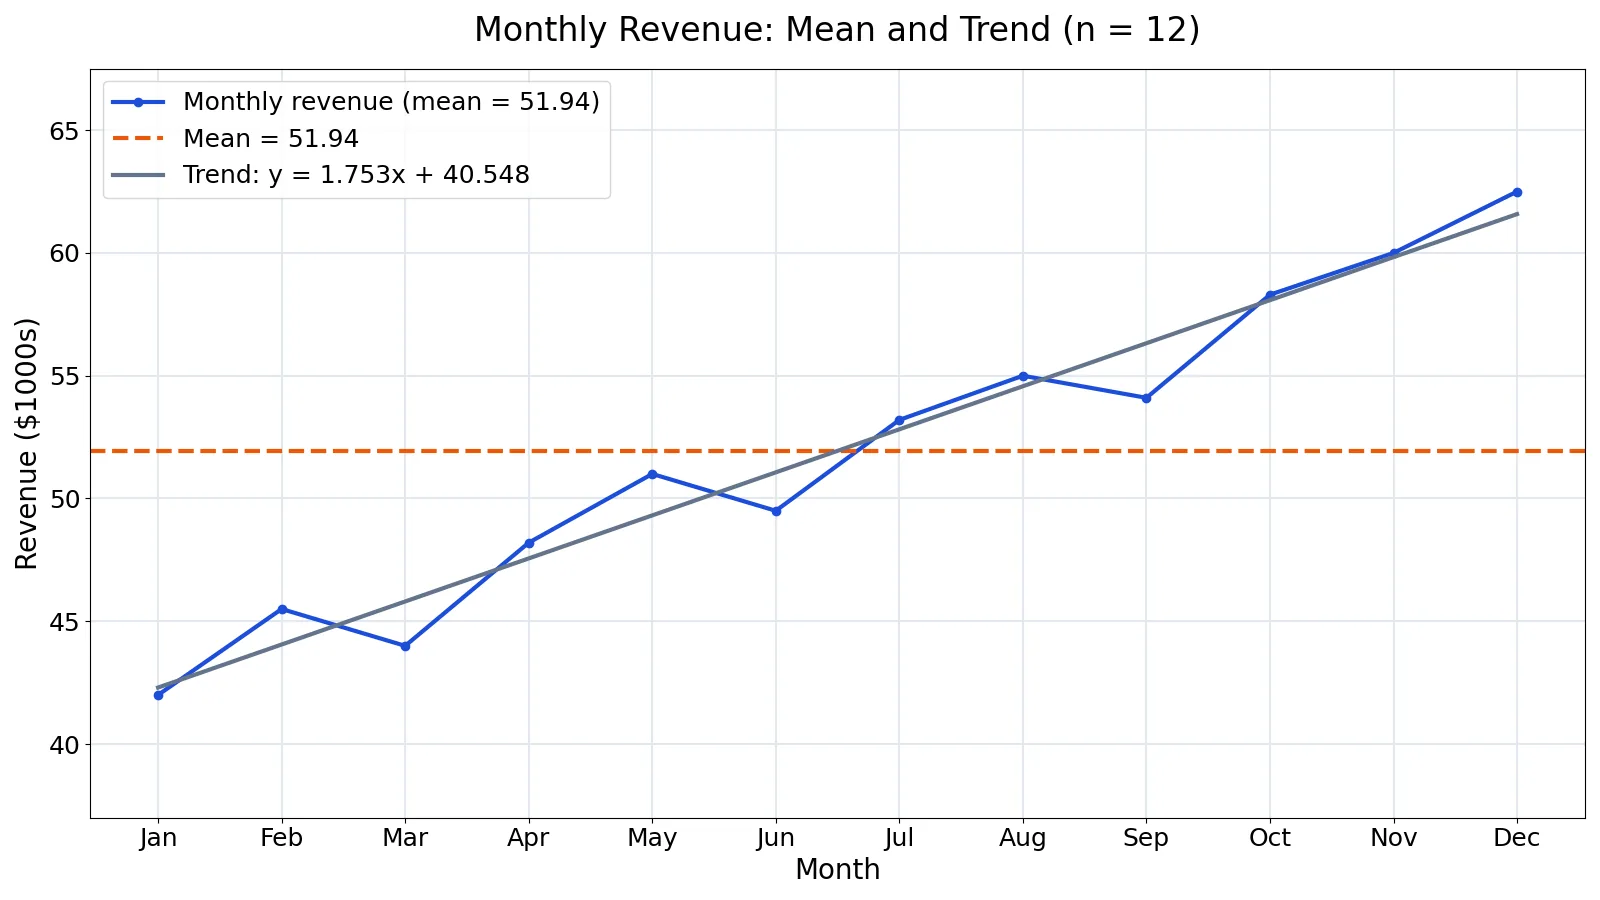
Step 6: Fit a least-squares trend. The slope is $1.7528$ and the intercept is $40.5485$, giving:
$$\text{revenue} = 1.7528 \times \text{month} + 40.5485$$
Step 7: Read the result. Revenue averages 51.94 thousand dollars per month and rises by about 1.75 thousand dollars each month, indicating a clear upward trend.
Here is the code that produces those numbers.
import statistics, numpy as np
revenue = [42.0, 45.5, 44.0, 48.2, 51.0, 49.5,
           53.2, 55.0, 54.1, 58.3, 60.0, 62.5]
mean = statistics.mean(revenue)
median = statistics.median(revenue)
stdev = statistics.stdev(revenue)
slope, intercept = np.polyfit(range(1, len(revenue)+1), revenue, 1)
Output:
mean=51.9417, median=52.1000, stdev=6.4434, slope=1.7528, intercept=40.5485How to Interpret It
Read the summary numbers together, never alone. The mean of 51.94 tells you the center. The standard deviation of 6.44 tells you how much a typical month moves. The slope of 1.75 tells you the direction and speed of change.
A slope of 1.7528 means each additional month adds about 1.75 thousand dollars to expected revenue. Across the 11 steps from January to December that adds up to roughly 19.3 thousand dollars of growth, close to the 20.5 thousand gap between the January value of 42.0 and the December value of 62.5.
The intercept of 40.5485 is the fitted value at month zero, which does not exist in the data. It is a mathematical anchor for the line, not a real revenue figure. Treat it that way.
Finally, check whether the trend is meaningful. Twelve points with a steady rise is suggestive, but a single unusual month can create a slope that does not reflect the underlying pattern. Plot the data before you trust the number. A line chart of the 12 monthly values with the mean line at 51.94 and the fitted trend line makes the upward pattern visible at a glance.
When to Use It (and when not to)
Use data analysis when you have a question that data can answer, when the data is reasonably complete, and when a decision depends on the answer. Typical cases include comparing groups, tracking performance over time, testing whether a change made a difference, and finding which factors move an outcome.
Use it when the cost of being wrong is high enough to justify the work. A quick look at a dashboard is fine for a routine check. A pricing change, a staffing decision, or a published claim deserves the full process.
Do not use it when the question is not answerable with the data you have. If nobody recorded the variable you care about, no amount of analysis will recover it. Do not use it to confirm a decision you have already made, because you will unconsciously pick the summary that supports you. And do not run a statistical test on data collected in a way that violates the test's assumptions, since the result will look precise and be wrong [4].
Data Analysis vs Data Analytics
These two terms are often used interchangeably, but they describe different scopes. Data analysis is the inspection, cleaning, transformation and modeling of a single, already prepared dataset. Data analytics is the broader discipline that includes collecting and storing data, building the infrastructure, and reporting results [1].
| Data Analysis | Data Analytics | |
|---|---|---|
| Scope | One dataset, one question | End-to-end pipeline |
| Main work | Clean, explore, model, interpret | Collect, store, analyze, report |
| Typical output | A finding or a model | A system, dashboard or process |
| Relationship | A stage inside analytics [1] | The larger field |
If you are working through a single spreadsheet to answer one question, you are doing data analysis. If you are designing how data flows from source systems into reports, you are doing data analytics.
Common Mistakes
- Skipping the cleaning step. Missing values, duplicates and inconsistent units distort every number downstream. Fix: profile the data first, checking counts, ranges and types before you compute anything [2].
- Reporting the mean alone. A mean of 51.94 hides whether every month was near 52 or whether the values swung from 20 to 80. Fix: always pair a center with a spread.
- Using the mean on skewed data. When a few extreme values pull the average, the mean stops representing a typical case. Fix: compare the mean and median, and report the median when they diverge.
- Confusing correlation with causation. A trend line shows that revenue and time move together, not that time caused the rise. Fix: state the relationship as an association unless you have a controlled design.
- Extrapolating the trend too far. The fitted line predicts 40.55 at month zero, a period with no data. Fix: keep predictions inside the range you observed.
- Choosing the method after seeing the result. Testing several approaches and reporting the one that looks best inflates your false positive rate. Fix: decide the method before you look at the outcome.
Limitations
Data analysis cannot create information that is not in the data. If your sample is biased, your measurements are noisy, or a key variable was never recorded, the analysis will produce confident-looking numbers that mislead. Improper statistical analysis distorts findings and can mislead readers, which is why the accuracy and appropriateness of the analysis matters as much as the data itself [4].
Summary statistics also compress. A mean, a median and a standard deviation can describe two completely different datasets identically. The only reliable guard is to look at the raw values and plot them before you summarize. And every method carries assumptions, from independence of observations to the shape of the distribution. When those assumptions fail, the output is still a number, but it no longer means what the formula says it means.
Frequently Asked Questions
What is the definition of data analysis in simple terms?
Data analysis is the process of examining data to find useful answers. You clean it, look at it from different angles, apply methods like averages or trend lines, and explain what the results mean. The goal is a conclusion someone can act on, supported by evidence rather than opinion.
What are the main steps of data analysis?
The standard sequence is to define the context, type of data and goals of the analysis, then design a collection strategy, clean and standardize the data, explore it, apply the appropriate method, and interpret the results [2]. Qualitative work follows a similar arc but groups text into themes and builds narratives instead of computing statistics [2].
What is the difference between analyzing data and analyzing data meaning?
They are the same activity described at different levels. Analyzing data is the mechanical work of computing summaries and fitting models. Analyzing data meaning is the interpretive step, where you decide what those numbers imply for the question you started with. Both are required, and skipping the second one leaves you with output nobody can use.
Do I need statistics to do data analysis?
You need enough statistics to choose the right summary and to know when a method's assumptions are violated. Descriptive work such as means, medians and trends covers a large share of everyday questions. Inferential work, such as hypothesis testing and regression, requires more care because the conclusions extend beyond the data you observed [2].
How much data do I need?
It depends on the question and the variability. Highly variable measurements need more observations to detect a pattern than stable ones. A useful rule is to check whether your conclusion would survive removing a few points. If one unusual value flips the answer, you do not have enough data to make the claim yet.
References
- Data Analysis vs Data Analytics: What Is the Difference? - Bay Atlantic University - Washington, D.C.
- Data Analysis | Assessment and Research
- 1.1.2. How Does Exploratory Data Analysis differ from Classical Data Analysis?
- Data Analysis
Further Reading
- Data Analytics vs. Business Analytics: Key Differences
- Wilson G, Bryan J, Cranston K et al. (2017). Good enough practices in scientific computing. PLOS Computational Biology
Related Articles
- What Is Data Mining? Definition, Meaning and Examples
- What Is Data? Definition, Meaning and Examples in Science
- How to Analyse Data in Excel: Step by Step
- What Is Analytics? Definition, Types and Examples
- What Is a Dataset? Definition, Types and Examples
- Statistical Data Analysis
- What Does a Data Analyst Do? Roles, Skills, and Career Path
- What Is a Data Analyst? Understanding the Role and Its Value