Pandas in Python: What It Is and How to Use DataFrames
By Dr. Zubair Khalid, DVM, MS, PhD ·
Pandas in Python is the standard library for working with tabular data. It gives you a DataFrame, a two-dimensional table with labeled rows and columns, plus fast tools for loading, cleaning, filtering, and summarizing that table. If your work involves spreadsheets, CSV files, or SQL query results, pandas is usually the first tool analysts reach for.
Quick Answer
- A DataFrame is two-dimensional, size-mutable tabular data with labeled axes, so rows and columns both carry labels [1].
- You load data with functions like
pd.read_csv(), then inspect it with.head(),.dtypes,.shape, and.info(). - Arithmetic aligns on row and column labels, which means pandas matches values by label before computing [1].
.groupby()splits rows by a key, applies an aggregation, and returns one result per group.- Pandas handles the middle of the analysis workflow: loading, reshaping, and summarizing data before you model or chart it.
What pandas in Python Means
In plain terms, pandas is a Python library that stores data in tables and gives you a large set of operations for those tables. You import it as pd by convention, and most of your work happens on one object: the DataFrame.
The precise definition is narrower. A DataFrame is two-dimensional, size-mutable, potentially heterogeneous tabular data with labeled axes for rows and columns [1]. "Heterogeneous" means columns can hold different types, so one column can be text and the next can be a float. "Labeled axes" means every row and column has an index you can refer to by name instead of position. Pandas describes the DataFrame as a dict-like container for Series objects, where each column is a Series [1].
That design is why pandas fits so many tasks. A column of dates, a column of region names, and a column of prices can live in one table, and operations like multiplication or averaging apply column by column.
How It Works
A DataFrame is built from data, an index, and columns. The constructor signature is pandas.DataFrame(data=None, index=None, columns=None, dtype=None, copy=None) [1]. When you pass a dictionary, column order follows insertion order, and if the dictionary contains Series with their own indexes, pandas aligns them by index [1].
The core mechanism is label alignment. When you add, subtract, or compare two pandas objects, the operation matches values by label first. For a single column operation, the formula is element-wise:
$$ \text{revenue}_i = \text{units}_i \times \text{unit\_price}_i $$
Here $\text{units}_i$ is the number of units sold in row $i$ and $\text{unit\_price}_i$ is the price per unit in that same row. The result is a new value for each row.
For a grouped summary, the mean within a group is:
$$ \bar{x}_g = \frac{1}{n_g}\sum_{i \in g} x_i $$
where $g$ is the group, $n_g$ is the number of rows in that group, and $x_i$ is the value for row $i$. Pandas computes this for every group in one call.
Worked Example
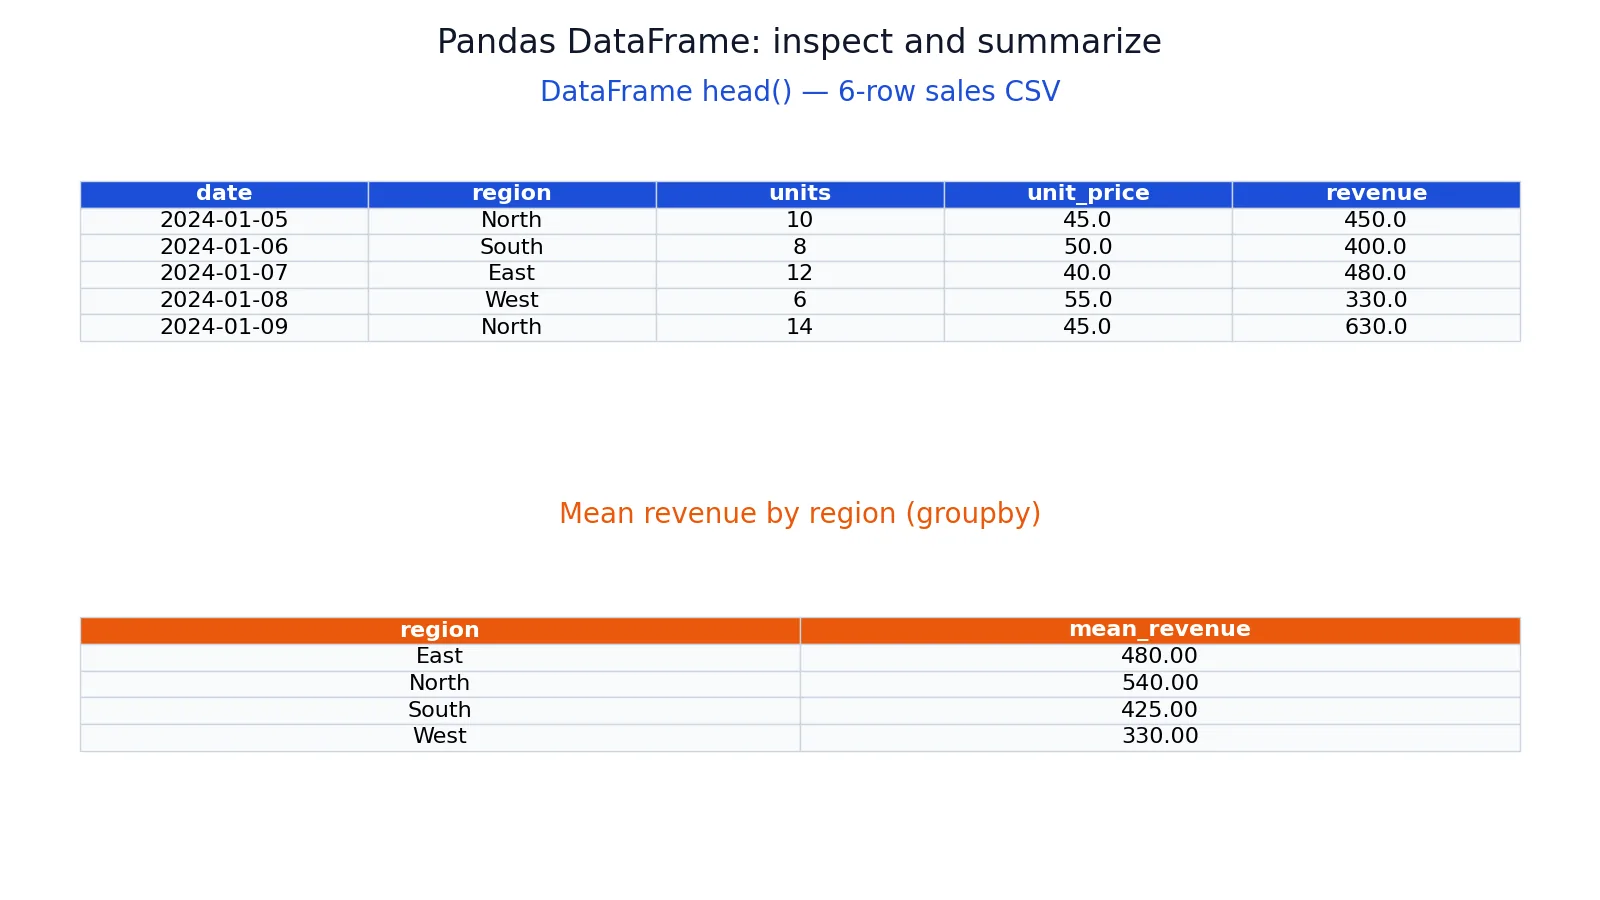
The dataset is a 6-row sales CSV with columns for date, region, units, and unit price. Revenue is computed as units times unit price.
| date | region | units | unit_price | revenue |
|---|---|---|---|---|
| 2024-01-05 | North | 10 | 45 | 450 |
| 2024-01-06 | South | 8 | 50 | 400 |
| 2024-01-07 | East | 12 | 40 | 480 |
| 2024-01-08 | West | 6 | 55 | 330 |
| 2024-01-09 | North | 14 | 45 | 630 |
| 2024-01-10 | South | 9 | 50 | 450 |
Step 1: load the CSV. pd.read_csv() returns a DataFrame with shape 6 rows by 5 columns.
Step 2: add the revenue column with df["revenue"] = df["units"] * df["unit_price"]. This multiplies the two columns row by row.
Step 3: inspect dtypes. The result is date object, region object, units int64, unit_price float64, revenue float64.
Step 4: preview with .head(), which shows the first five rows.
Step 5: group by region and take the mean revenue. North is 540.0, South is 425.0, East is 480.0, and West is 330.0.
Step 6: check the arithmetic. North has two rows, so $(10 \times 45.0 + 14 \times 45.0) / 2 = 540.00$. South has two rows, so $(8 \times 50.0 + 9 \times 50.0) / 2 = 425.00$. East has one row, so $12 \times 40.0 = 480.00$. West has one row, so $6 \times 55.0 = 330.00$.
Step 7: total revenue is 2740.00, and the overall mean revenue is $2740.00 / 6 = 456.67$.
import pandas as pd

df = pd.read_csv("sales.csv")
df["revenue"] = df["units"] * df["unit_price"]

print(df.dtypes)
print(df.head())

print(df.groupby("region")["revenue"].mean())
Output:
dtypes:
date           object
region         object
units           int64
unit_price    float64
revenue       float64

head:
      date region  units  unit_price  revenue
2024-01-05  North     10        45.0    450.0
2024-01-06  South      8        50.0    400.0
2024-01-07   East     12        40.0    480.0
2024-01-08   West      6        55.0    330.0
2024-01-09  North     14        45.0    630.0

groupby mean revenue:
region
East     480.0
North    540.0
South    425.0
West     330.0
How to Interpret It
Read the dtypes first. If units shows as int64 and unit_price as float64, both columns are numeric and arithmetic will work as expected. If a numeric column shows as object, the values are being treated as text, and multiplication or averaging will fail or produce unexpected results.
Read the groupby output as one number per group. North at 540.0 means the average revenue per North sale is 540.0, not the total. The overall mean of 456.67 is the average across all six rows. Compare the group means to that overall figure to see which regions sit above or below the average.
Watch the group sizes. East and West each have one row, so their means are just that single sale. North and South each have two rows. A mean built from one observation is far less stable than one built from many, and pandas will not warn you about the difference.
When to Use It (and when not to)
Use pandas when your data fits comfortably in memory and you need to load, clean, reshape, join, or summarize tables. It handles CSV and Excel files, database query results, and JSON. It pairs naturally with NumPy for numeric work and with plotting libraries for charts. If you need to combine tables, see how to merge DataFrames in Python. If you need grouped summaries, the pandas groupby guide covers the full set of aggregations.
Skip pandas when the dataset is far larger than your machine's memory. At that point you want a distributed or out-of-core tool. Skip it too when you only need a single pass over a huge log file, where plain Python loops or streaming reads are simpler. For quick column selection at load time, read_csv usecols keeps memory down.
DataFrame vs Series
The Series is the closest related structure. A DataFrame is a table, and a Series is a single labeled one-dimensional array. Every column of a DataFrame is a Series.
| Feature | DataFrame | Series |
|---|---|---|
| Dimensions | 2 | 1 |
| Axes | Rows and columns | One index |
| Data types | Can mix across columns | One dtype |
| Typical use | Full tables | One column or vector |
| Selection | .loc, .iloc on rows and columns | .loc on index labels, .iloc on positions |
If you are comfortable with Python dictionaries, the mental model carries over well. A DataFrame is close to a dictionary of columns, and you can read more in the Python dictionaries guide.
Common Mistakes
- Treating a numeric column as a number when it loaded as
object. Fix it withpd.to_numeric()or by cleaning the source values before loading. - Confusing
.loc(label-based) with.iloc(integer position). Use.locwhen you know the label and.ilocwhen you know the position [1]. - Assuming
mean()returns a total. It returns an average. Usesum()for totals. - Forgetting that operations align on labels. If two objects have different indexes, pandas matches by label and can produce missing values where labels do not overlap [1].
- Comparing two Series with different labels and expecting a simple element-wise result. Pandas raises an error when the labels do not match [2].
- Ignoring group sizes. A group mean from one row looks the same in the output as a mean from a thousand rows.
Limitations
Pandas loads data into memory, so the size of your dataset is bounded by available RAM. Operations that create copies, such as many merges and reshapes, can multiply memory use well beyond the original table. For datasets that do not fit, you need a different tool.
Pandas also does not enforce a schema. A column can silently hold mixed types, and a numeric column can arrive as text without any warning. You have to check dtypes yourself. Label alignment is powerful but can surprise you when indexes differ between objects, since the result may contain missing values where you expected a direct match.
Frequently Asked Questions
What is pandas in Python used for?
Pandas is used for loading, cleaning, transforming, and summarizing tabular data. Analysts use it to read CSV and Excel files, filter rows, compute new columns, group data, and join tables. It sits between raw data sources and the modeling or visualization step.
Do I need NumPy to use pandas?
Pandas depends on NumPy and uses it internally for numeric storage, so NumPy is installed alongside pandas. You do not have to import NumPy yourself for basic DataFrame work, though importing it is common when you need array operations or random number generation.
How do I check the data types in a DataFrame?
Use df.dtypes to see the type of each column, or df.info() for types plus non-null counts and memory usage. Checking types early catches numeric columns that loaded as text, which is one of the most common causes of failed arithmetic.
What is the difference between head() and sample()?
head() returns the first rows of the DataFrame, five by default. sample() returns randomly selected rows. Use head() for a quick look at the top of the file and sample() when you want an unbiased peek that is not skewed by how the file is sorted.
Can pandas handle dates and times?
Yes. Pandas has datetime types and parsing tools. A date column often loads as object text, and you convert it with pd.to_datetime() before doing date arithmetic or resampling. Once converted, you can extract components like month or weekday and group by them.
References
- pandas.DataFrame, pandas 3.0.6 documentation
- Essential basic functionality, pandas 3.0.6 documentation
Further Reading
- Intro to data structures, pandas 3.0.6 documentation
- Harris CR, Millman KJ, van der Walt SJ et al. (2020). Array programming with NumPy. Nature
- McKinney W (2010). Data Structures for Statistical Computing in Python. Proceedings of the Python in Science Conference
- The Python Tutorial