Pandas groupby: How to Group and Aggregate Data in Python
By Dr. Zubair Khalid, DVM, MS, PhD ·
Grouping data is one of the most common tasks in analysis, and groupby pandas is the tool that handles it. You split a DataFrame into groups based on one or more keys, apply a function to each group, and combine the results into a new table. This article walks through the syntax, a full worked example, and the mistakes that trip people up.
Quick Answer
df.groupby('column')returns a GroupBy object that holds the split data. Nothing is computed until you call an aggregation method [1].- The pattern is split-apply-combine: split rows by key, apply a function per group, combine the outputs [2].
- Chain an aggregation to get results, for example
df.groupby('region')['sales'].sum(). .agg(['sum','mean'])applies several functions at once and returns one column per function [1].- Group by several columns with a list, for example
df.groupby(['region','product']), and the group name becomes a tuple [1].
Before You Start
You need pandas installed and imported. The examples here use a DataFrame with two columns, region and sales, and twelve rows. Any DataFrame with a categorical column and a numeric column will behave the same way.
Two ideas matter before you write code. First, groupby does not return a DataFrame. It returns a pandas.api.typing.DataFrameGroupBy instance, which is a lazy object that describes the groups [1]. You inspect it by iterating, or you reduce it by calling an aggregation. Second, the grouping key can be a column name, a list of column names, a Series, a dictionary, a function, or a pd.Grouper [2]. A string passed to groupby may refer to a column or an index level, and if a name matches both, pandas raises a ValueError because the key is ambiguous [1].
If you are new to the DataFrame itself, start with Pandas in Python: What It Is and How to Use DataFrames and come back here.
Step by Step
- Load your data. Build or read a DataFrame with at least one grouping column and one numeric column. Confirm the shape so you know how many rows you are splitting.
- Choose your group key. Pass the column name as a string.
df.groupby('region')is syntactic sugar fordf.groupby(df['region']), so both forms produce the same groups [1].
- Select the column to aggregate. After
groupby, index the numeric column with['sales']. This keeps the output to one column instead of aggregating every numeric column in the frame.
- Apply an aggregation. Call
.sum(),.mean(),.count(),.min(),.max(), or.agg()with a list of function names. An aggregation reduces each group to a scalar value per column [1].
- Read the result. The output is a DataFrame indexed by the group keys. The group column moves into the index by default because
as_index=True[2].
- Reset the index if you need a flat table. Call
.reset_index()to turn the group keys back into regular columns, which is handy before plotting or exporting.
- Group by more than one key when needed. Pass a list such as
['region','product']. The group name in iteration becomes a tuple, and the result gets a MultiIndex [1].
Worked Example
The dataset is a 12-row sales table with a region column and a sales column.
| region | sales |
|---|---|
| North | 120 |
| South | 90 |
| East | 150 |
| West | 200 |
| North | 180 |
| South | 110 |
| East | 130 |
| West | 220 |
| North | 160 |
| South | 100 |
| East | 140 |
| West | 210 |
The frame has shape (12, 2). Group by region and aggregate sales with sum and mean.
import pandas as pd

df = pd.DataFrame({
    'region': ['North','South','East','West','North','South',
               'East','West','North','South','East','West'],
    'sales': [120,90,150,200,180,110,130,220,160,100,140,210],
})

result = df.groupby('region')['sales'].agg(['sum','mean'])
print(result)
Output:
        sum        mean
region
East    420  140.000000
North   460  153.333333
South   300  100.000000
West    630  210.000000
Walking through the arithmetic for each group:
- East: $\sum [150, 130, 140] = 420$, and the mean is $420 / 3 = 140.0000$.
- North: $\sum [120, 180, 160] = 460$, and the mean is $460 / 3 = 153.3333$.
- South: $\sum [90, 110, 100] = 300$, and the mean is $300 / 3 = 100.0000$.
- West: $\sum [200, 220, 210] = 630$, and the mean is $630 / 3 = 210.0000$.
The grand total across all twelve rows is 1810, and the overall mean is 150.8333. Notice that the mean of the group means, (140 + 153.3333 + 100 + 210) / 4 = 150.8333, matches the overall mean here because each region has three rows. When group sizes differ, averaging the group means gives a different answer from the overall mean.
The formula for a group mean is:
$$\bar{x}_g = \frac{1}{n_g}\sum_{i \in g} x_i$$
where $n_g$ is the number of rows in group $g$.
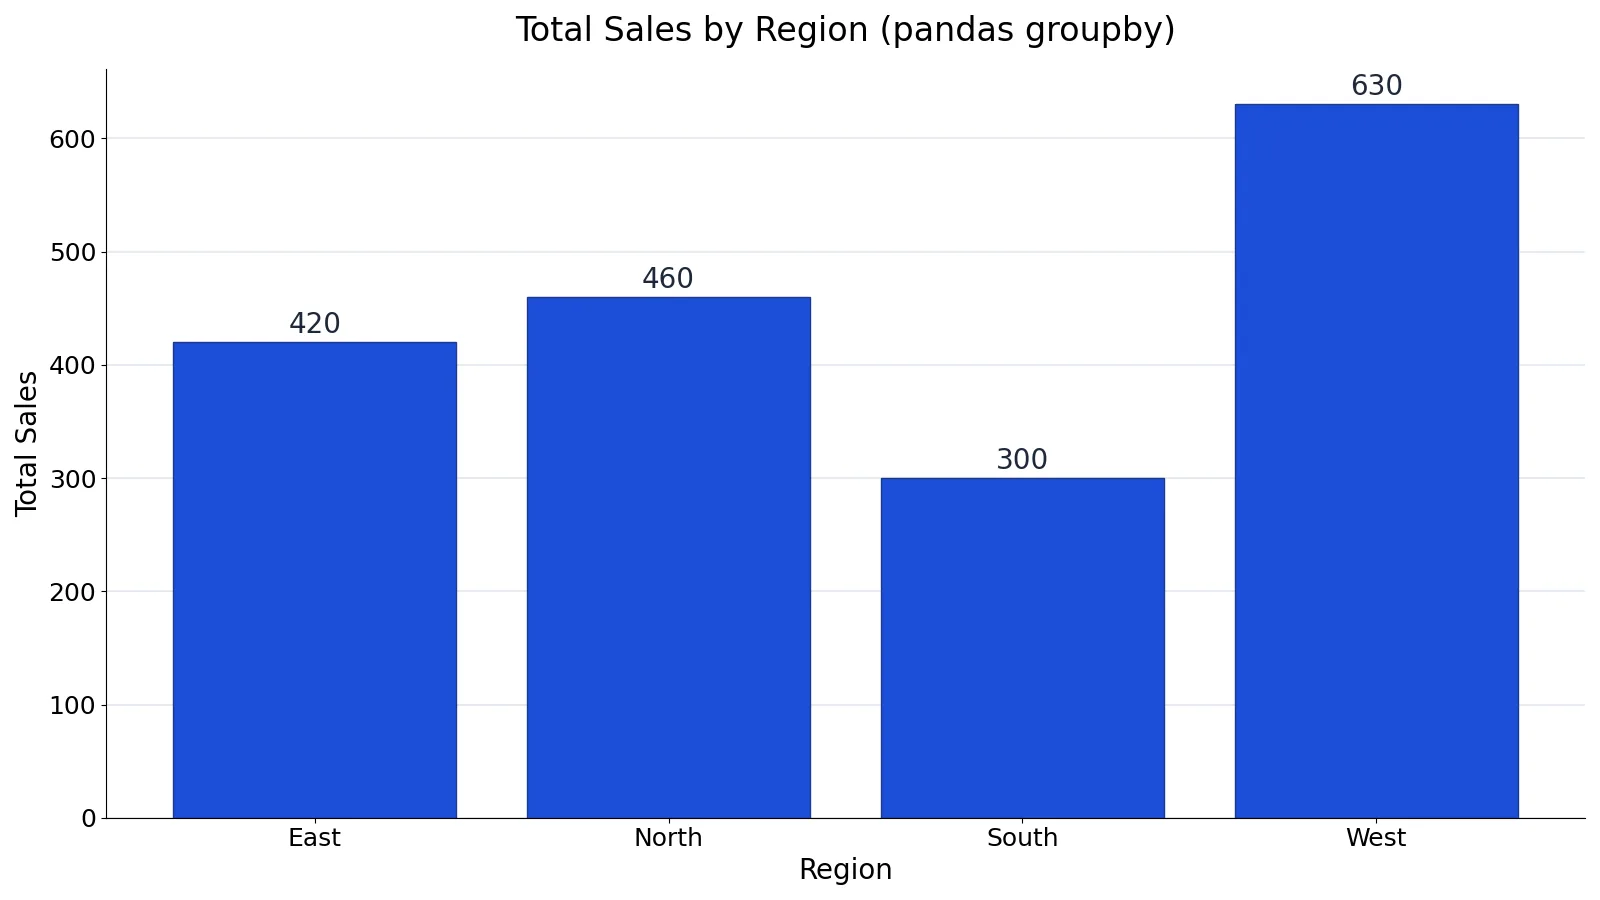
A bar chart of total sales by region shows East=420, North=460, South=300, and West=630, with the grand total at 1810.
Other Ways to Do It
Named aggregation. Use .agg() with keyword arguments to name your output columns directly, instead of getting the function names as column headers.
result = df.groupby('region')['sales'].agg(total='sum', average='mean')Multiple keys. Pass a list to split on more than one column. The result is indexed by both keys.
result = df.groupby(['region', 'product'])['sales'].sum()Group by a Series or array. Pass any array of the same length as the frame. ser.groupby([0, 1, 0, 1]).mean() groups by numeric labels, and ser.groupby(ser > 100).mean() groups by a boolean condition [3].
Group by an index level. If your data has a MultiIndex, use level=0 or level='Type' to group by a level name instead of a column [3].
Iterate over groups. Loop with for name, group in df.groupby('region') to inspect each subframe. With multiple keys, the name is a tuple [1]. Use df.groupby(['region','product']).get_group(('North','Widget')) to pull one group out directly [1].
Transform and filter. transform returns an object aligned to the original rows, which is useful for adding a group mean as a new column. filter keeps or drops whole groups based on a condition.
If you need to combine grouped results with another table afterward, see Pandas Merge: How to Join DataFrames in Python (Examples).
Troubleshooting
You get a GroupBy object instead of a table. You have not applied an aggregation yet. Add .sum(), .mean(), or .agg().
A column disappears from the output. The grouping column becomes the index by default. Call .reset_index() to bring it back as a column.
KeyError on the column name. Check spelling and whitespace. A string passed to groupby can match either a column or an index level. A missing name raises KeyError, and a name that exists in both places raises a ValueError about ambiguity [1].
Unexpected NaN values. Rows with missing keys are dropped from the groups by default because dropna=True. Set dropna=False to keep NA as its own group [2].
Too many columns in the result. Without a column selection, aggregations run on every eligible column. Select the numeric column first with ['sales'].
Common Mistakes
- Forgetting the aggregation.
df.groupby('region')alone returns a GroupBy object, not a summary. Fix: chain.sum(),.mean(), or.agg(). - Assuming the group column stays a column. It moves to the index by default. Fix: call
.reset_index()when you want a flat table. - Averaging group means to get an overall mean. This is only correct when every group has the same number of rows. Fix: compute the overall mean from the raw data, or use a weighted average.
- Using
.apply()when a built-in aggregation works..apply()is flexible but slower and can change the output shape. Fix: prefer.agg()with named functions for standard reductions. - Ignoring missing keys. NA values are excluded from groups unless you pass
dropna=False[2]. Fix: decide explicitly whether NA should form its own group. - Grouping on a high-cardinality column. Grouping by a near-unique ID produces one row per group and tells you nothing. Fix: group on a categorical column with a small number of distinct values.
Limitations
groupby operates along axis 0, meaning rows. To split by columns you have to transpose first, which is rarely what you want [1]. The implementation is hash-based, so objects that compare as equal land in the same group, and pandas collapses all NA values into a single group regardless of how they compare [2]. Grouping by a column with many distinct values produces a wide, sparse result that is hard to read.
Memory is another constraint. Grouping a very large frame materializes intermediate structures, and a .apply() that returns a differently shaped object per group can be slow and unpredictable. For data that does not fit in memory, you generally need a different tool or a chunked approach. Finally, groupby summarizes what is in your data. It cannot tell you whether a difference between groups is statistically meaningful, and it will happily report a mean for a group with a single row.
Frequently Asked Questions
What does groupby do in pandas?
It splits a DataFrame into groups based on one or more keys, applies a function to each group, and combines the results [2]. The pattern is called split-apply-combine. The initial call returns a GroupBy object, and the actual computation happens when you call an aggregation method [1].
How do I group by multiple columns?
Pass a list of column names, for example df.groupby(['region','product']). The result is indexed by both keys, and when you iterate, each group name is a tuple [1]. You can then aggregate as usual with .sum() or .agg().
How do I keep the grouped column as a regular column?
Use .reset_index() on the result. By default as_index=True, which places the group keys in the index [2]. Resetting the index turns them back into columns, which is convenient before plotting or writing to a file.
What is the difference between agg and apply?
agg applies one or more functions that each reduce a group to a scalar, and it returns a predictable shape [1]. apply passes each group as a subframe to your function and can return anything, which makes it more flexible but slower and harder to predict.
Why are my NaN group keys missing from the result?
Rows with missing group keys are dropped by default because dropna=True [2]. Pass dropna=False to groupby and NA values will be treated as their own group key instead of being excluded.
References
- Group by: split-apply-combine, pandas 3.0.6 documentation
- pandas.DataFrame.groupby, pandas 3.0.6 documentation
- pandas.Series.groupby, pandas 3.0.6 documentation
Further Reading
- pandas.DataFrame.groupby, pandas 2.3.3 documentation
- Harris CR, Millman KJ, van der Walt SJ et al. (2020). Array programming with NumPy. Nature
- McKinney W (2010). Data Structures for Statistical Computing in Python. Proceedings of the Python in Science Conference