pandas crosstab: How to Tabulate Counts in Python
By Dr. Zubair Khalid, DVM, MS, PhD ·
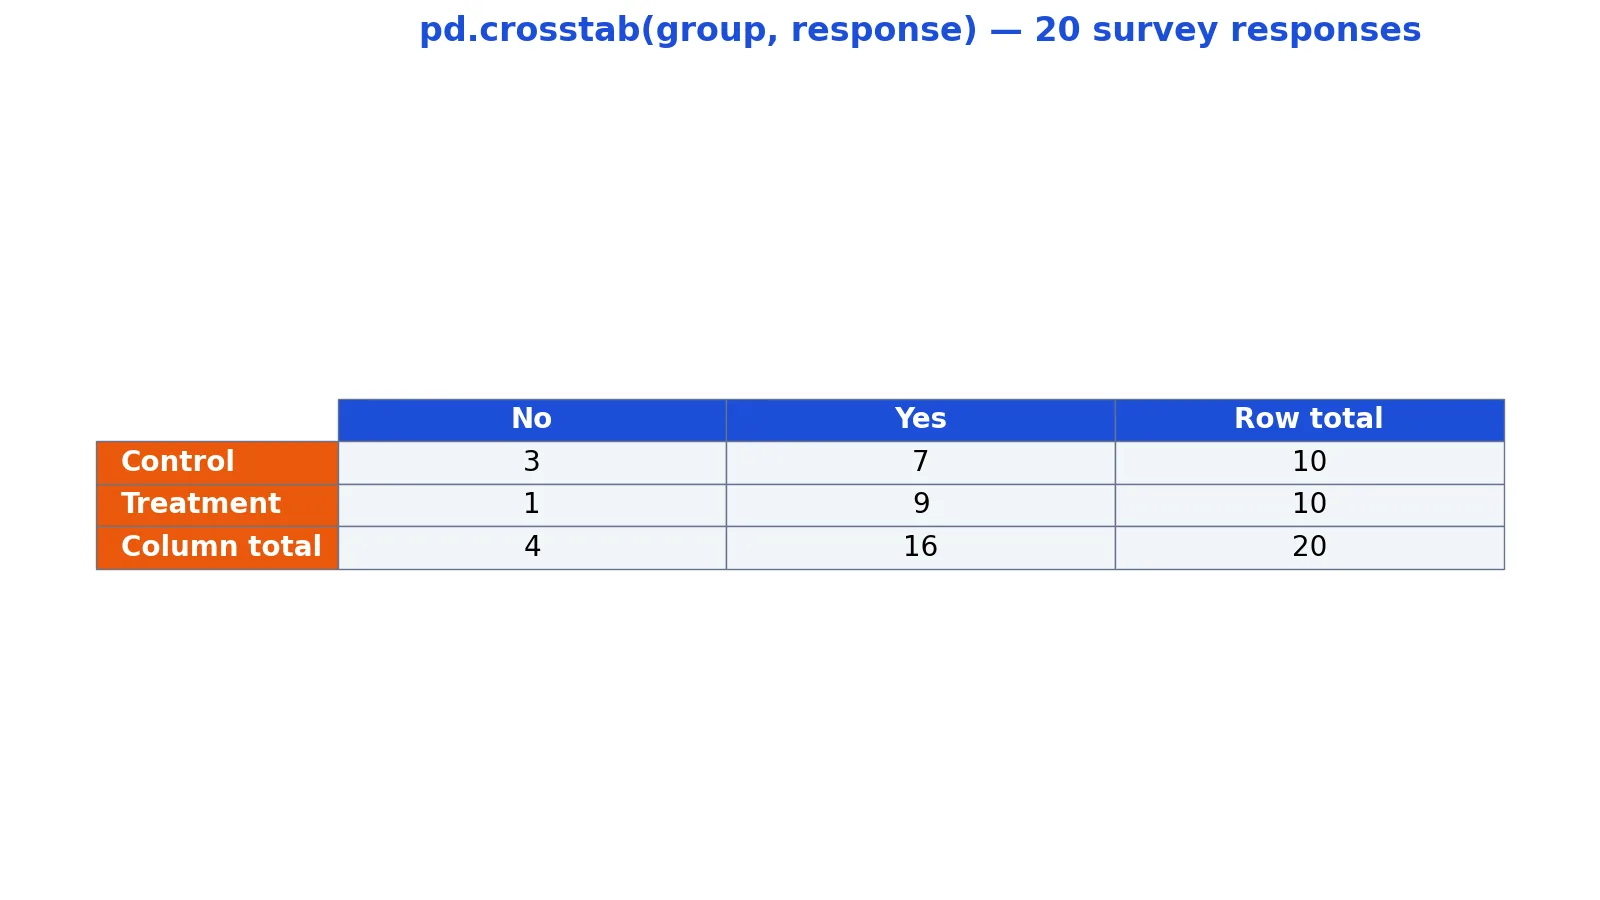
To tabulate counts of two categorical variables in pandas, call pd.crosstab() with the two columns as arguments. It returns a DataFrame whose rows are the categories of the first variable, whose columns are the categories of the second, and whose cells hold the number of matching rows. This is the fastest way to tabulate a frequency table in Python without writing loops or groupby chains.
Quick Answer
pd.crosstab(index, columns)counts how many rows fall into each combination of the two variables.- The first argument becomes the row index, the second becomes the column labels.
- Add
margins=Trueto append row and column totals plus a grand total. - Add
normalize='index','columns'or'all'to get proportions instead of counts. - The result is a regular DataFrame, so you can rename axes, sort it or export it with
.to_csv().
Syntax
| Argument | Required? | Meaning |
|---|---|---|
index | Yes | Array, Series or list of values that become the row labels. |
columns | Yes | Array, Series or list of values that become the column labels. |
values | No | A column to aggregate. Without it, crosstab counts rows. |
aggfunc | No | Aggregation function used with values, such as 'mean' or 'sum'. |
margins | No | If True, adds row totals, column totals and a grand total. |
normalize | No | Divides counts by the total. Accepts True, 'all', 'index' or 'columns'. |
dropna | No | If True, drops columns whose entries are all NaN. |
rownames / colnames | No | Names for the row and column axes of the result. |
How It Works
pd.crosstab() builds a frequency table by grouping rows that share the same pair of category values [1]. Conceptually it does the same job as a pivot table in a spreadsheet, but it works on a DataFrame directly and returns another DataFrame.
The mechanics are simple. Every row in your data has one value for the row variable and one value for the column variable. Crosstab finds each distinct pair, counts how many rows produced it, and places that count in the matching cell. Cells with no matching rows are filled with 0, which is why a crosstab often shows combinations that never occurred in your data.
Because the output is a DataFrame, the index holds the row categories and the columns hold the column categories. That structure makes it easy to read a two-way table, compare groups and compute percentages by dividing one axis by its total.
If you want a refresher on what the resulting grid means, see what cross tabulation is and how to read it.
Worked Example
The dataset is a small survey with 20 responses. Each row records a group label (Control or Treatment) and a response (Yes or No).
| group | response |
|---|---|
| Control | Yes |
| Control | Yes |
| Control | Yes |
| Control | No |
| Control | Yes |
| Control | No |
| Control | Yes |
| Control | Yes |
| Control | No |
| Control | Yes |
| Treatment | Yes |
| Treatment | Yes |
| Treatment | Yes |
| Treatment | Yes |
| Treatment | Yes |
| Treatment | Yes |
| Treatment | No |
| Treatment | Yes |
| Treatment | Yes |
| Treatment | Yes |
Step 1. Build the DataFrame. The list has 20 entries, so len(df) = 20.
Step 2. Call pd.crosstab(df['group'], df['response']). The result has shape = 2x2, one row per group and one column per response.
Step 3. Read the Control row. It contains 3 No and 7 Yes, giving a row total of 10.
Step 4. Read the Treatment row. It contains 1 No and 9 Yes, also a row total of 10.
Step 5. Read the column totals. There are 4 No responses and 16 Yes responses across both groups.
Step 6. Check the grand total. It is 20, matching the number of rows.
Step 7. Convert to shares. The Control Yes share is $7 / 10 \times 100 = 70.0000\%$. The Treatment Yes share is $9 / 10 \times 100 = 90.0000\%$.
import pandas as pd

df = pd.DataFrame({
    "group": ["Control"]*10 + ["Treatment"]*10,
    "response": ["Yes","Yes","Yes","No","Yes","No","Yes","Yes","No","Yes",
                 "Yes","Yes","Yes","Yes","Yes","Yes","No","Yes","Yes","Yes"],
})

ct = pd.crosstab(df['group'], df['response'])
print(ct)
Output:
response   No  Yes
group
Control    3   7
Treatment  1   9
The table shows that the Treatment group has a higher Yes count (9) than the Control group (7), even though both groups have 10 respondents. Counts alone can hide that, so always check the row totals before comparing.
More Examples
Add totals with margins. Passing margins=True appends a row and column of sums plus a grand total.
pd.crosstab(df['group'], df['response'], margins=True)Get row percentages. normalize='index' divides each cell by its row total, so every row sums to 1.
pd.crosstab(df['group'], df['response'], normalize='index')Get column percentages. normalize='columns' divides each cell by its column total instead.
pd.crosstab(df['group'], df['response'], normalize='columns')Aggregate a numeric column. If you have a third numeric column, pass it as values with an aggfunc to get means instead of counts.
pd.crosstab(df['group'], df['response'], values=df['score'], aggfunc='mean')Three-way tables. Passing a list as the first argument adds another level to the row index, which is useful when you want to split counts by a third variable.
pd.crosstab([df['group'], df['site']], df['response'])If you are coming from spreadsheet counting, the logic is the same as a conditional count. The COUNTIF function in Excel does one cell at a time, while crosstab fills the whole grid at once.
Errors and How to Fix Them
KeyError on a column name. This means the string you passed does not match any column. Check spelling and case, and print df.columns to confirm the exact labels.
ValueError about arrays of different length. The two arguments must describe the same rows. If you sliced one Series, slice the other the same way or pass columns from the same DataFrame.
Extra rows or columns for the same category. Usually caused by whitespace or inconsistent capitalization in the category values, such as "Yes" and "yes" being treated as different categories. Clean the values before calling crosstab.
Unexpected NaN column. When dropna=False, columns that are entirely missing are kept. Set dropna=True if you want them removed.
Aggregation error with values. If you pass values without aggfunc, pandas raises a ValueError. Pass aggfunc whenever you pass values.
Common Mistakes
- Comparing raw counts across groups of different sizes. A count of 9 out of 10 is not the same as 9 out of 100. Use
normalize='index'to compare shares. - Forgetting that missing combinations become 0. A zero cell means no rows matched, which is not the same as missing data. Check your source data before reading a 0 as a real result.
- Leaving dirty category labels in place. Trailing spaces, mixed case and abbreviations split one real category into several. Strip and standardize values first.
- Reading percentages without checking the base. A 100% Yes rate based on 1 respondent is noise. Always look at the row or column totals alongside the proportions.
- Using crosstab for numeric variables. Crosstab is built for categories. Binning a numeric column into ranges first gives a readable table, otherwise you get one column per distinct value.
- Assuming the row order is meaningful. Categories appear in sorted order by default. Reindex the result if you need a specific order.
Limitations
Crosstab describes counts and proportions. It does not test whether a difference between groups is statistically significant, and it does not control for other variables. A higher Yes share in one group can be explained by a third factor you did not include, so treat the table as a description of your sample, not as evidence of cause.
The function also struggles with high-cardinality variables. If a column has hundreds of distinct values, the resulting table becomes wide and hard to read, and most cells will be sparse or zero. In that case, group rare categories together or filter to the categories you care about before tabulating. Very large inputs also consume memory proportional to the number of distinct category pairs, since every combination needs a cell.
Frequently Asked Questions
What is the difference between crosstab and groupby?
pd.crosstab() is a convenience wrapper that produces a two-dimensional frequency table directly. A groupby with .size() or .count() can produce the same numbers, but you then have to reshape the result with .unstack() to get the grid layout. Crosstab is shorter for this specific task.
How do I get percentages instead of counts?
Pass normalize='index' for row percentages, normalize='columns' for column percentages, or normalize='all' to divide every cell by the grand total. The output contains floats between 0 and 1. Multiply by 100 if you want percentage points.
Can I add row and column totals?
Yes. Set margins=True and pandas appends an All row and an All column, plus the grand total in the bottom-right cell. You can rename that label with the margins_name argument.
How do I sort the resulting table?
The result is a DataFrame, so use .sort_values() on a column or .sort_index() on the axis. For example, sorting by the Yes column puts the group with the most Yes responses first.
Does crosstab handle missing values?
By default, rows with missing values in either variable are excluded from the counts. If you want to see them, fill the missing entries with a label such as "Unknown" before calling crosstab, then the category appears as its own row or column.
References
Further Reading
- Harris CR, Millman KJ, van der Walt SJ et al. (2020). Array programming with NumPy. Nature
- The Python Tutorial
- Wilson G, Bryan J, Cranston K et al. (2017). Good enough practices in scientific computing. PLOS Computational Biology
- Virtanen P, Gommers R, Oliphant TE et al. (2020). SciPy 1.0: fundamental algorithms for scientific computing in Python. Nature Methods
- pandas User Guide