How to Calculate Variance in Excel (Step by Step)
By Dr. Zubair Khalid, DVM, MS, PhD ·
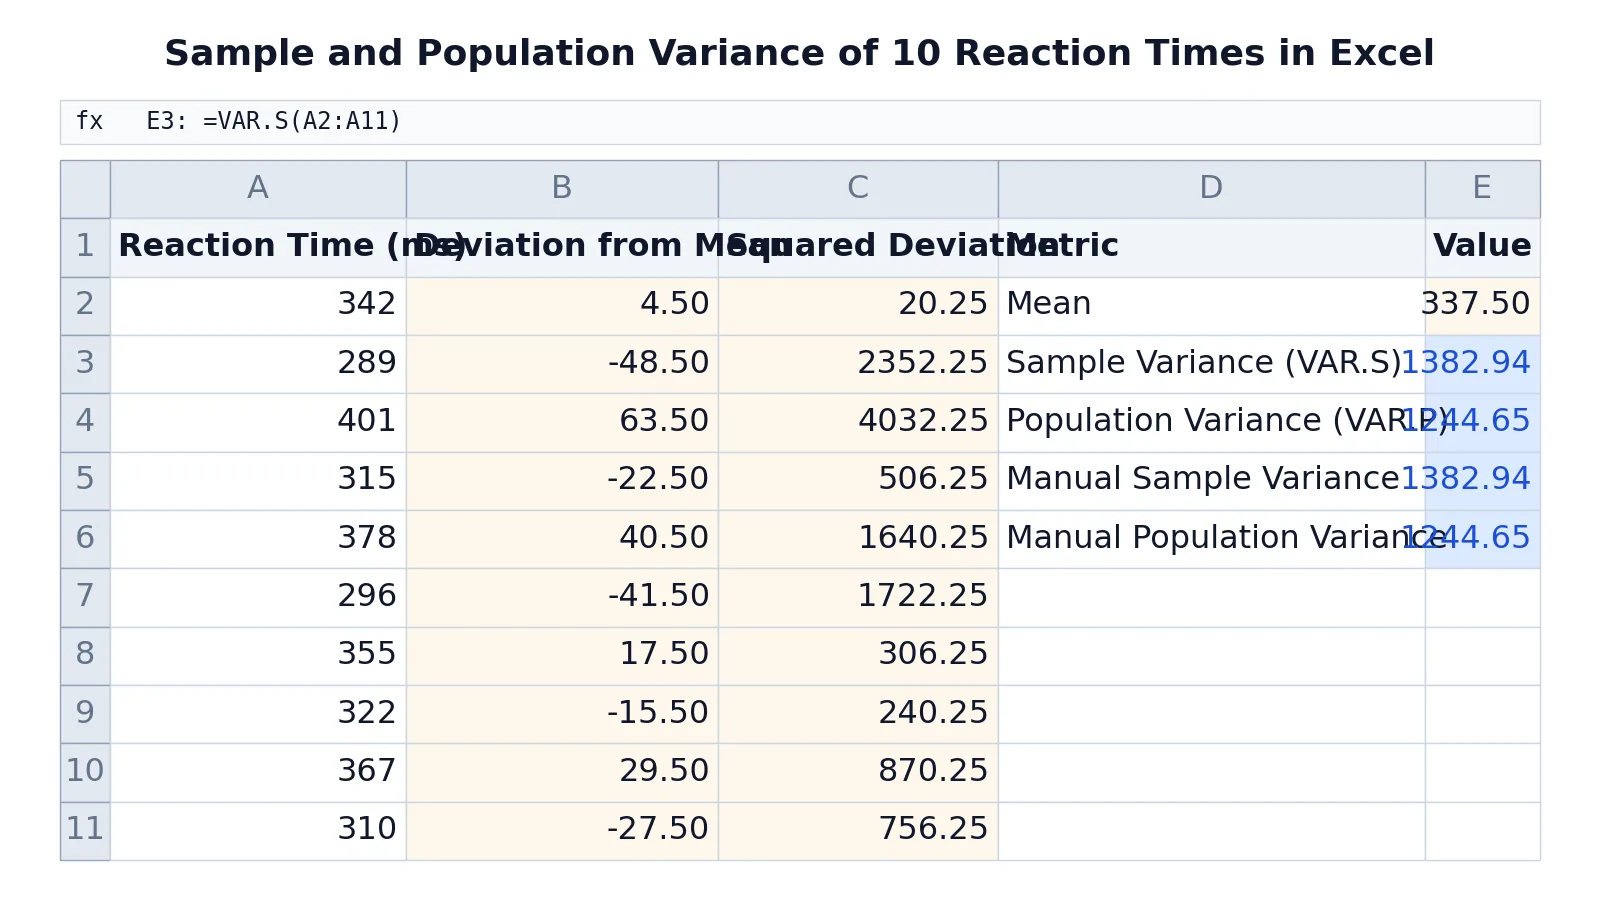
To calculate variance in Excel, use =VAR.S(range) when your numbers are a sample and =VAR.P(range) when they are the entire population. Both functions take a range like A2:A11 and return the variance in one step. If you want to see how the number is built, you can also compute it manually from squared deviations.
Quick Answer
- Sample variance:
=VAR.S(A2:A11)[1] - Population variance:
=VAR.P(A2:A11)[1] - Sample variance divides the sum of squared deviations by $n-1$, population variance divides by $n$ [2]
VAR.Signores empty cells, text, and logical values inside a range [1]- The older
VARfunction still works but Microsoft recommends the newerVAR.S[2]
Before You Start
Variance measures how spread out a set of numbers is around its mean. A small variance means the values sit close to the average. A large variance means they are scattered widely.
The first decision is whether your data is a sample or a population. A sample is a subset of a larger group, such as 10 reaction times drawn from thousands of trials. A population is every value you care about, such as the test scores of one complete class. This choice changes the divisor and therefore the answer, so pick it before you type a formula.
Put your numbers in a single column with one value per cell and no blank rows inside the range. If you are new to writing formulas, see how to make a formula in Excel first. It also helps to know how to calculate the mean in Excel, because the mean is the center that variance measures distance from.
Step by Step
- Enter your data in a column, starting at
A2and running down. LeaveA1for a header. - Click an empty cell where you want the result.
- For a sample, type
=VAR.S(A2:A11)and press Enter. ReplaceA2:A11with your actual range. - For a population, type
=VAR.P(A2:A11)and press Enter. - Read the result. Excel returns a single number, the variance of the values in that range.
If you prefer to see the arithmetic, add a helper column. In B2, enter =A2-AVERAGE($A$2:$A$11) to get each value's deviation from the mean. In C2, enter =B2^2 to square that deviation. Fill both down. Then:
$$s^2 = \frac{\sum (x_i - \bar{x})^2}{n-1}$$
for the sample, and:
$$\sigma^2 = \frac{\sum (x_i - \bar{x})^2}{n}$$
for the population. In Excel, the sample version is =SUM(C2:C11)/(COUNT(A2:A11)-1) and the population version is =SUM(C2:C11)/COUNT(A2:A11). Both should match the function results exactly.
Worked Example
The dataset below holds 10 reaction times in milliseconds, treated as a sample of a larger set of trials.
| Row | A: Reaction Time (ms) | B: Deviation from Mean | C: Squared Deviation | D: Metric | E: Value |
|---|---|---|---|---|---|
| 1 | Reaction Time (ms) | Deviation from Mean | Squared Deviation | Metric | Value |
| 2 | 342 | =A2-AVERAGE($A$2:$A$11) -> 4.50 | =B2^2 -> 20.25 | Mean | =AVERAGE(A2:A11) -> 337.50 |
| 3 | 289 | =A3-AVERAGE($A$2:$A$11) -> -48.50 | =B3^2 -> 2352.25 | Sample Variance (VAR.S) | =VAR.S(A2:A11) -> 1382.94 |
| 4 | 401 | =A4-AVERAGE($A$2:$A$11) -> 63.50 | =B4^2 -> 4032.25 | Population Variance (VAR.P) | =VAR.P(A2:A11) -> 1244.65 |
| 5 | 315 | =A5-AVERAGE($A$2:$A$11) -> -22.50 | =B5^2 -> 506.25 | Manual Sample Variance | =SUM(C2:C11)/(COUNT(A2:A11)-1) -> 1382.94 |
| 6 | 378 | =A6-AVERAGE($A$2:$A$11) -> 40.50 | =B6^2 -> 1640.25 | Manual Population Variance | =SUM(C2:C11)/COUNT(A2:A11) -> 1244.65 |
| 7 | 296 | =A7-AVERAGE($A$2:$A$11) -> -41.50 | =B7^2 -> 1722.25 | ||
| 8 | 355 | =A8-AVERAGE($A$2:$A$11) -> 17.50 | =B8^2 -> 306.25 | ||
| 9 | 322 | =A9-AVERAGE($A$2:$A$11) -> -15.50 | =B9^2 -> 240.25 | ||
| 10 | 367 | =A10-AVERAGE($A$2:$A$11) -> 29.50 | =B10^2 -> 870.25 | ||
| 11 | 310 | =A11-AVERAGE($A$2:$A$11) -> -27.50 | =B11^2 -> 756.25 |
The mean is 337.50. The sample variance is 1382.94 and the population variance is 1244.65. The manual columns produce the same two numbers, which confirms the functions are working as expected. Notice that the sample variance is larger, because dividing by 9 instead of 10 gives a bigger result for the same sum of squared deviations.
Other Ways to Do It
The VAR function is the older name for sample variance. It still works and returns the same value as VAR.S, but Microsoft has replaced it and recommends the newer function [2]. Use VAR.S in new workbooks.
If your range contains text or logical values that you want counted as numbers, VARA estimates variance based on a sample while including those values [3]. VARP is the older population function, and VARPA is its counterpart that includes text and logical values [3].
For a wider analysis, the Analysis ToolPak add-in includes a Covariance tool. The diagonal entries of its output table are the population variance of each variable, computed the same way as VAR.P [4]. This is useful when you are comparing several columns at once.
If you just want a quick number without opening Excel, the Variance Calculator takes a list of values and returns the sample and population variance. When you are ready to look at the bigger picture, how to analyse data in Excel covers the surrounding workflow.
Troubleshooting
If Excel returns #DIV/0!, your range has fewer than two numeric values. Sample variance needs at least two numbers because it divides by $n-1$.
If the result looks far too small, check whether you used VAR.P on data that is really a sample. The population formula divides by the larger number, so it always returns a smaller value.
If the result is zero, every value in the range is identical. That is correct, not an error.
If a cell you expected to count is being skipped, it probably contains text or a logical value. VAR.S ignores those inside a range [1]. Use VARA if you want them included [3].
If the formula returns #VALUE!, one of your arguments is text that cannot be read as a number [2].
Common Mistakes
- Using
VAR.Pon sample data. The population formula divides by $n$, which understates the spread of a sample. UseVAR.Sunless you truly have every value. - Using
VAR.Son a full population. This overstates the spread. If the range is the complete group, useVAR.P. - Typing numbers directly into the formula instead of referencing cells. Direct arguments work, but text representations of numbers typed this way are counted, which can surprise you [1]. Reference a range instead.
- Leaving blank rows inside the range. Blank cells are ignored, so the count of numeric values may not match what you expect. Keep the range tight.
- Mixing units. Variance is in squared units, so reaction times in milliseconds give a variance in milliseconds squared. Compare variances only when the units match.
- Confusing variance with standard deviation. Variance is the squared spread. If you want a number in the original units, take the square root, which is what standard deviation does.
Limitations
Variance is sensitive to outliers. One extreme value can inflate the result a lot because the deviation is squared. A single value far from the mean can dominate the total, so a large variance does not always mean the data is generally spread out.
Variance is also expressed in squared units, which makes it hard to interpret on its own. A variance of 1382.94 for reaction times in milliseconds does not map directly to any millisecond value. For a figure you can compare to the original data, use the standard deviation instead. Finally, variance describes spread only. It says nothing about the shape of the distribution, so two very different datasets can share the same variance.
Frequently Asked Questions
How do I calculate variance in Excel for a sample?
Type =VAR.S(A2:A11), replacing the range with your own. This estimates variance based on a sample and divides the sum of squared deviations by $n-1$ [1]. Use it whenever your data is a subset of a larger group.
How do you calculate variance in Excel for a whole population?
Use =VAR.P(A2:A11). This calculates variance based on the entire population and divides by $n$ [3]. The result is always smaller than the sample variance for the same numbers.
What is the difference between VAR.S and VAR.P?
They differ only in the divisor. VAR.S divides by $n-1$ and VAR.P divides by $n$ [1]. The sample version corrects for the fact that a sample tends to underestimate the spread of the full population.
Why does my variance formula return a different number than I expected?
The most common cause is using the wrong function for your data type. Check whether you have a sample or a population. Also confirm the range contains only the cells you meant to include, since empty cells, text, and logical values inside a range are ignored [1].
Can I calculate variance without the VAR functions?
Yes. Add a column of deviations with =A2-AVERAGE($A$2:$A$11), square each one with =B2^2, then divide the sum of squares by COUNT(A2:A11)-1 for a sample or COUNT(A2:A11) for a population. This manual route gives the same answer and shows the arithmetic behind it. For a refresher on the underlying formula, see how to calculate variance.
References
- VAR.S function | Microsoft Support
- VAR function | Microsoft Support
- Statistical functions (reference) | Microsoft Support
- Use the Analysis ToolPak to perform complex data analysis | Microsoft Support
Further Reading
- Broman KW, Woo KH (2018). Data Organization in Spreadsheets. The American Statistician
- Ziemann M, Eren Y, El-Osta A (2016). Gene name errors are widespread in the scientific literature. Genome Biology