How to Find the Median from a Histogram (Step by Step)
By Dr. Zubair Khalid, DVM, MS, PhD ·
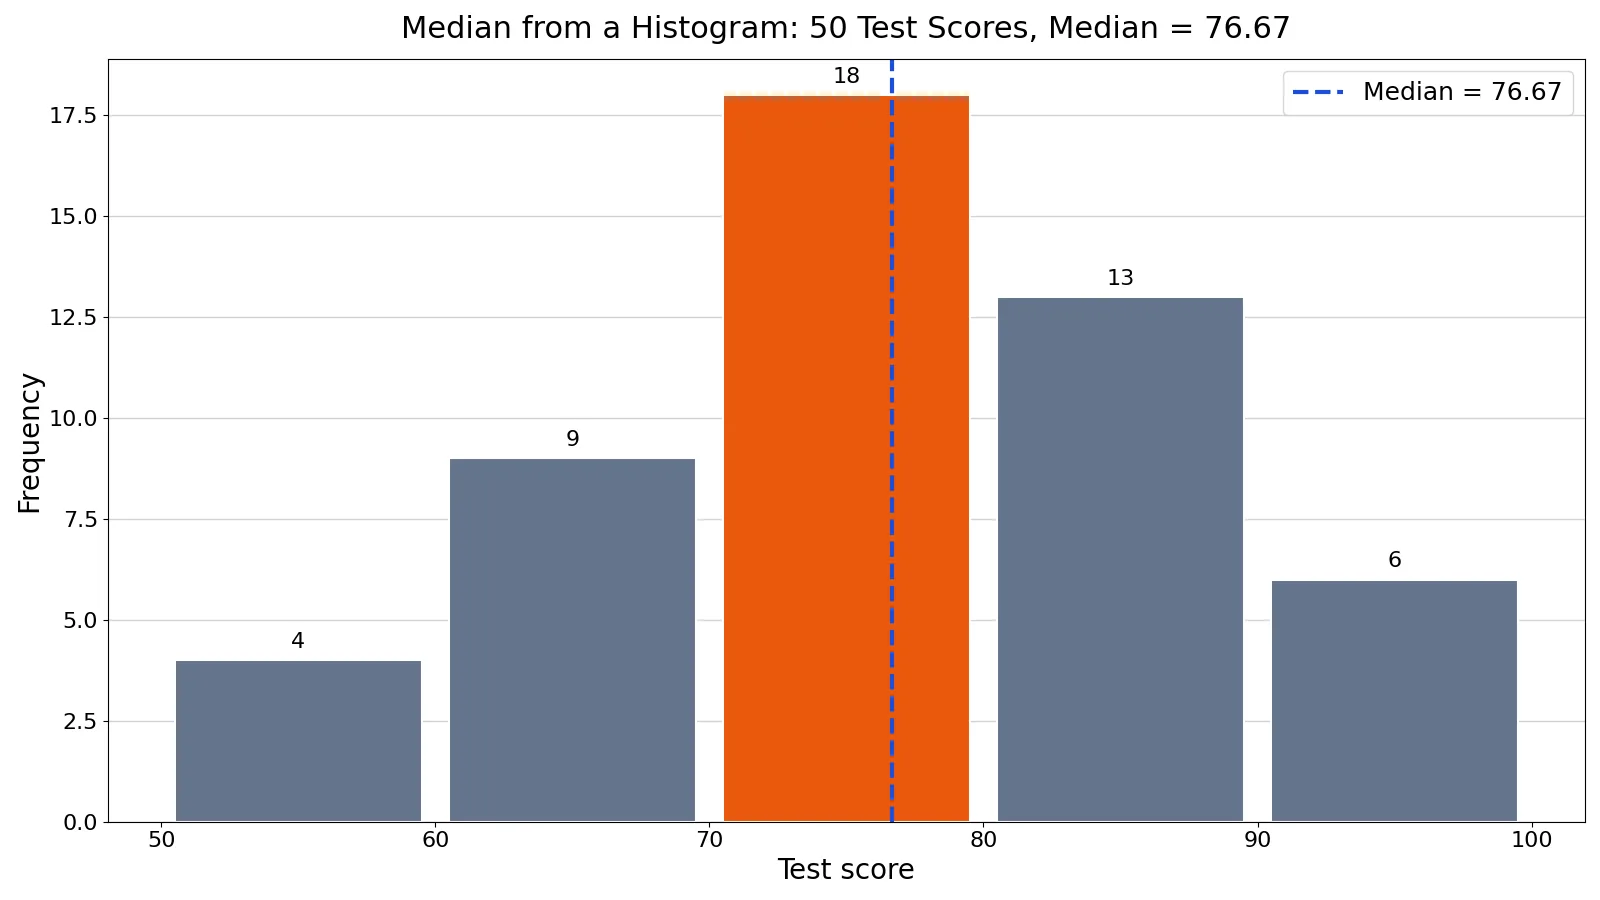
To find the median from a histogram, locate the class interval where the cumulative frequency first reaches half the total, then interpolate inside that interval. The formula is $\text{Median} = L + \frac{N/2 - cf}{f} \times w$, where $L$ is the lower boundary of the median class, $cf$ is the cumulative frequency before it, $f$ is its frequency, and $w$ is the class width. This article shows how to find median from a histogram step by step, with a worked example you can follow in a spreadsheet or in Python.
Quick Answer
- Add up all frequencies to get $N$, then compute $N/2$.
- Build a cumulative frequency column and find the first class whose cumulative frequency is at least $N/2$. That is the median class.
- Read $L$ (lower boundary of the median class), $cf$ (cumulative frequency before it), $f$ (frequency of the median class), and $w$ (class width).
- Plug them into $\text{Median} = L + \frac{N/2 - cf}{f} \times w$.
- The result is an estimate, not the exact median, because the histogram has already replaced individual values with ranges [1].
Before You Start
A histogram shows counts per bin, so the original data values are gone. You cannot recover the exact median from a histogram, but you can calculate a best estimate by assuming the data inside each bin are spread uniformly across that bin [1]. That assumption is what makes the interpolation formula work.
You need four things from the histogram or its frequency table:
| Item | Symbol | Meaning |
|---|---|---|
| Total count | $N$ | Sum of all bar heights |
| Median class | First bin where cumulative count reaches $N/2$ | |
| Lower boundary | $L$ | Bottom edge of the median class |
| Cumulative before | $cf$ | Count in all bins to the left of the median class |
| Frequency | $f$ | Height of the median class bar |
| Class width | $w$ | Upper boundary minus lower boundary |
Two details trip people up. First, use boundaries, not labels. A bin labeled 70-80 has a lower boundary of 70 only if the data are recorded to whole numbers and the bins are contiguous. Second, if your histogram uses relative frequencies instead of counts, multiply each relative frequency by $N$ first, or work with proportions and replace $N/2$ with $0.5$ [2].
If you are still deciding how to build the bins, see how to make a histogram in Excel.
Step by Step
- Sum the frequencies. Add every bar height to get $N$.
- Halve it. Compute $N/2$. This is the position of the median in rank order.
- Build cumulative frequencies. Running total from the leftmost bin to the rightmost.
- Find the median class. The first bin whose cumulative frequency is greater than or equal to $N/2$. If a cumulative frequency equals $N/2$ exactly, the median sits on the boundary between that bin and the next one.
- Read off $L$, $cf$, $f$, and $w$. $L$ is the lower boundary of the median class. $cf$ is the cumulative frequency of the bin immediately before it. $f$ is the median class frequency. $w$ is the class width.
- Apply the formula.
$$\text{Median} = L + \frac{N/2 - cf}{f} \times w$$
The fraction $\frac{N/2 - cf}{f}$ tells you how far into the median class you need to travel, as a proportion of that class. Multiplying by $w$ converts that proportion into data units.
Worked Example
The dataset is the test scores of 50 students grouped into 10-point bins.
| Bin | Frequency |
|---|---|
| 50-60 | 4 |
| 60-70 | 9 |
| 70-80 | 18 |
| 80-90 | 13 |
| 90-100 | 6 |
Step 1. Total frequency.
$$N = 4 + 9 + 18 + 13 + 6 = 50$$
Step 2. Half of N.
$$N/2 = 50/2 = 25.0$$
Step 3. Cumulative frequencies.
| Bin | Frequency | Cumulative |
|---|---|---|
| 50-60 | 4 | 4 |
| 60-70 | 9 | 13 |
| 70-80 | 18 | 31 |
| 80-90 | 13 | 44 |
| 90-100 | 6 | 50 |
Step 4. Median class. The first cumulative frequency that reaches 25.0 is 31, in the 70-80 bin. So the median class is 70-80.
Step 5. Read the inputs.
- $L = 70$
- $w = 10$
- $cf = 13$
- $f = 18$
Step 6. Interpolate.
$$\text{Median} = 70 + \frac{25.0 - 13}{18} \times 10$$
$$= 70 + \frac{12.0}{18} \times 10 = 70 + 0.6667 \times 10$$
$$= 76.6667$$
The estimated median is 76.67. Because the median class holds 18 of the 50 scores, the estimate lands well inside the 70-80 bin, closer to its upper edge.
Here is the same calculation in Python.
import numpy as np
bins = [(50,60),(60,70),(70,80),(80,90),(90,100)]
freqs = [4,9,18,13,6]
N = sum(freqs)
cum = np.cumsum(freqs)
i = next(k for k,c in enumerate(cum) if c >= N/2)
L, w = bins[i][0], bins[i][1]-bins[i][0]
cf = cum[i-1] if i>0 else 0
median = L + (N/2 - cf)/freqs[i] * w
print(round(median, 4))  # 76.6667
Output:
76.6667Other Ways to Do It
Spreadsheet. Put bins in one column and frequencies in the next. Add a cumulative column with a running sum. Find the median class by eye or with a lookup, then type the formula into a cell. The arithmetic is identical to the manual version. If you want the exact median of the raw values instead of an estimate, see how to calculate median in Excel.
Statistical software. In R, you can compute a grouped median from a frequency table with a few lines of arithmetic. A walkthrough is in how to find the median in R.
Quick check. If you have the raw values, drop them into the Mean, Median & Mode Calculator and compare the exact median against your histogram estimate. A small gap means your bins are fine. A large gap usually means the data are skewed or the bins are too wide.
Sanity check with the mean. The grouped mean uses class midpoints. If the mean and the interpolated median are close, the distribution is roughly symmetric. If they differ a lot, expect the median to be the more reliable summary. The method is described in how to find the mean from a histogram.
Troubleshooting
The cumulative frequency never equals $N/2$ exactly. That is normal. Use the first bin that exceeds it. Only when a cumulative frequency lands exactly on $N/2$ does the median sit on a boundary.
Your answer falls outside the median class. You mixed up $cf$ and $f$, or you used the cumulative frequency including the median class instead of before it. Recheck step 5.
The bins are unequal widths. The formula still works, as long as $w$ is the width of the median class itself. The catch is reading the chart: with unequal bins the bar heights are usually frequency densities (frequency divided by width), so multiply each height by its bin width to recover the counts first.
The histogram uses proportions. Replace $N/2$ with $0.5$ and use the proportion values as $cf$ and $f$. The result is the same.
The first bin already contains the median. Then $cf = 0$ and the formula reduces to $L + \frac{N/2}{f} \times w$.
Common Mistakes
- Using the class midpoint as the median. The midpoint equals the interpolated median only when $N/2$ falls exactly halfway through the median class's count. Use interpolation instead.
- Using the cumulative frequency of the median class instead of the one before it. This pushes the estimate too far right. The numerator $N/2 - cf$ measures how much of the median class you still need.
- Using the bin label instead of the boundary. For a bin labeled 70-80 with whole-number data, the lower boundary is 70, but for bins like 70 to under 80 the boundary logic still matters. Write out the boundaries explicitly before substituting.
- Forgetting to halve N. Plugging $N$ into the numerator instead of $N/2$ gives a value near the top of the distribution.
- Mixing counts and proportions. If $N/2$ is in counts, $cf$ and $f$ must be counts too. Do not mix a proportion column with a count column.
- Reporting too many decimals. The estimate depends on the uniform-spread assumption, so 76.67 is honest and 76.6667 is false precision.
Limitations
The interpolation formula gives a best estimate, not the true median. The actual median can sit anywhere inside the median class depending on how the values cluster there [1]. If all 18 scores in the 70-80 bin happened to be 71, the true median would be near 71, not 76.67. Wider bins make this worse because more unknown values hide inside each bar.
The method also assumes a uniform spread of values within the median class. Skewed data and open-ended bins like "90 and above" make that assumption shaky. When you have the raw data, compute the exact median directly. Use the histogram estimate only when the raw values are unavailable, which is common when you are reading someone else's chart.
Frequently Asked Questions
Can I find the exact median from a histogram?
No. A histogram replaces each value with the bin it falls into, so the information needed for an exact median is gone [1]. You can only estimate it, and you can also state bounds: the true median lies somewhere inside the median class. The interpolation formula gives the best single estimate under the uniform-spread assumption.
What if two bins both reach N/2?
That cannot happen with a strict cumulative count, because cumulative frequencies only increase. If one bin's cumulative frequency equals $N/2$ exactly, the median is the boundary between that bin and the next. If the cumulative jumps past $N/2$, the median class is the bin where the jump occurred.
Does the formula work for relative frequency histograms?
Yes, with one change. Replace $N/2$ with 0.5 and use the relative frequencies as $cf$ and $f$. The proportion of the median class you need to cross is the same either way, so the final estimate is unchanged [2].
How do I find the median on a histogram with unequal bin widths?
Use counts, not bar heights. If the bars show frequency density, multiply each height by its bin width to get the frequency. Then find the median class by cumulative frequency as usual and apply the same formula, with $w$ equal to the width of the median class.
Is the histogram median the same as the median of the raw data?
Usually close, rarely identical. With narrow bins the estimate is typically within a fraction of a unit of the true median. With wide bins or heavily skewed data the gap can be several units. If accuracy matters, get the raw values and compute the median directly, or compare against a tool like the Mean, Median & Mode Calculator.
References
- [](http://www.cs.uni.edu/~campbell/stat/histrev2.html)
- 1.3.3.14. Histogram
Further Reading
- NIST/SEMATECH e-Handbook of Statistical Methods
- OpenStax. Introductory Statistics 2e
- Krzywinski M, Altman N (2013). Importance of being uncertain. Nature Methods
- Krzywinski M, Altman N (2013). Significance, P values and t-tests. Nature Methods
- Wasserstein RL, Lazar NA (2016). The ASA Statement on p -Values: Context, Process, and Purpose. The American Statistician