How to Calculate Cumulative Relative Frequency (Steps and Example)
By Dr. Zubair Khalid, DVM, MS, PhD ·
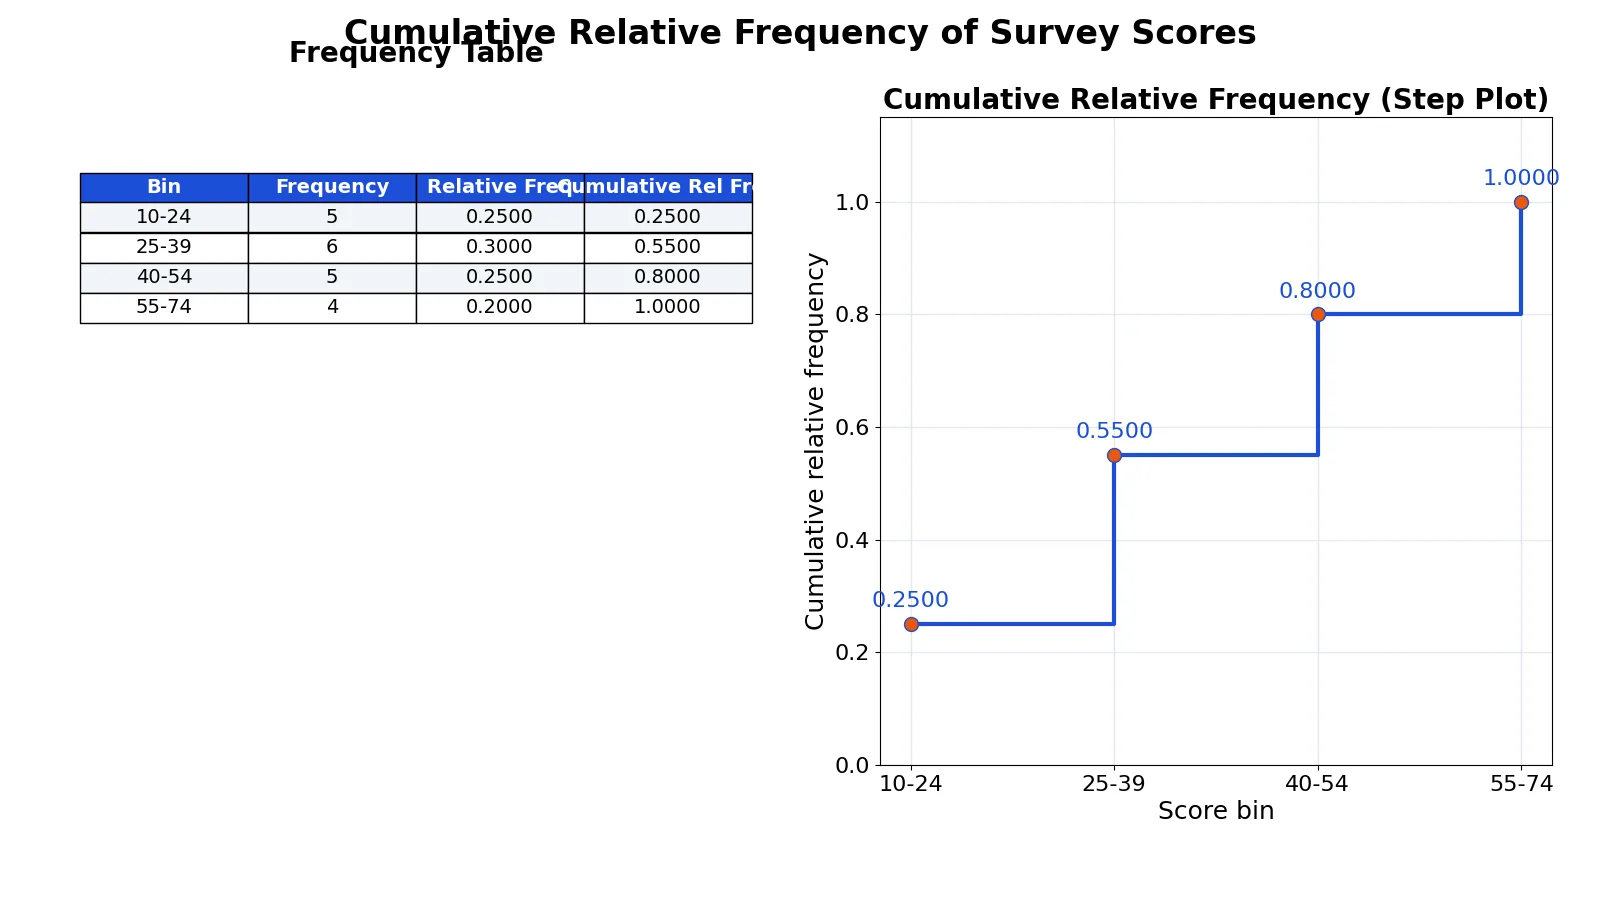
To calculate cumulative relative frequency, divide each class frequency by the total number of observations, then add the relative frequencies down the table so each row holds the running total up to that point. The final row always equals 1.0000 (or 100%) when the data is complete. This article shows how to calculate cumulative relative frequency by hand and in code, then explains what the running total tells you.
Quick Answer
- Relative frequency for one row is $\text{frequency} \div n$, where $n$ is the sample size.
- Cumulative relative frequency is the sum of that row's relative frequency and every relative frequency above it.
- The first row's cumulative value equals its own relative frequency.
- The last row's cumulative value is 1.0000, meaning 100% of the data has been counted [1].
- You can also get it by dividing cumulative frequency by $n$ [2].
Before You Start
You need a frequency table with two things in place: a set of non-overlapping class intervals (bins) and a count of how many observations fall in each bin. The bins must cover every value in the dataset, and each value must land in exactly one bin. If a value sits on a boundary, your binning rule decides which side it goes to. In the example below, bins are left-closed and right-open, so a score of 25 belongs to the 25-39 bin, not 10-24.
You also need the total sample size $n$. That is the sum of the frequency column, and it should match the number of rows in your raw data. If those two numbers disagree, fix the table before you compute anything else.
Two related ideas are worth separating now. Cumulative frequency counts observations up to a point. Cumulative relative frequency turns that count into a proportion of the whole [2]. If you want the counting version first, see how to calculate cumulative frequency step by step.
The formulas are short:
$$\text{Relative Frequency} = \frac{\text{Frequency}}{n}$$
$$\text{Cumulative Relative Frequency} = \frac{\text{Cumulative Frequency}}{n}$$
Both forms give the same answer. The second is handy when you already have a cumulative frequency column.
Step by Step
- Count the observations in each bin. Build the frequency column. Each entry is the number of data values inside that class interval.
- Find $n$. Add the frequency column. This total is your sample size.
- Divide each frequency by $n$. This gives the relative frequency for that row, written as a decimal, fraction, or percent [1].
- Copy the first relative frequency into the cumulative column. There is nothing above it to add.
- Add down the column. For each new row, take the previous cumulative value and add the current relative frequency [1].
- Check the last row. It should be 1.0000, or very close if rounding is involved [1].
The running total is the point of the whole exercise. After step 5, any row tells you the proportion of the dataset at or below the top of that bin.
Worked Example
A survey collected scores from 20 respondents. The scores are grouped into four bins: 10-24, 25-39, 40-54, and 55-74. Here is the raw data.
| Respondent | Score |
|---|---|
| 1 | 12 |
| 2 | 15 |
| 3 | 18 |
| 4 | 22 |
| 5 | 24 |
| 6 | 27 |
| 7 | 29 |
| 8 | 31 |
| 9 | 33 |
| 10 | 35 |
| 11 | 38 |
| 12 | 41 |
| 13 | 44 |
| 14 | 47 |
| 15 | 50 |
| 16 | 53 |
| 17 | 57 |
| 18 | 61 |
| 19 | 66 |
| 20 | 72 |
Step 1 and 2. Count the values in each bin and confirm the total.
- 10-24: 12, 15, 18, 22, 24 gives 5
- 25-39: 27, 29, 31, 33, 35, 38 gives 6
- 40-54: 41, 44, 47, 50, 53 gives 5
- 55-74: 57, 61, 66, 72 gives 4
The frequencies sum to 20, so $n = 20$.
Step 3. Divide each frequency by 20.
- 10-24: $5 / 20 = 0.2500$
- 25-39: $6 / 20 = 0.3000$
- 40-54: $5 / 20 = 0.2500$
- 55-74: $4 / 20 = 0.2000$
Steps 4 and 5. Add down the column.
- Up to 10-24: $0.0000 + 0.2500 = 0.2500$
- Up to 25-39: $0.2500 + 0.3000 = 0.5500$
- Up to 40-54: $0.5500 + 0.2500 = 0.8000$
- Up to 55-74: $0.8000 + 0.2000 = 1.0000$
Step 6. The final value is 1.0000, so the table is complete.
| Bin | Frequency | Relative Frequency | Cumulative Relative Frequency |
|---|---|---|---|
| 10-24 | 5 | 0.25 | 0.25 |
| 25-39 | 6 | 0.30 | 0.55 |
| 40-54 | 5 | 0.25 | 0.80 |
| 55-74 | 4 | 0.20 | 1.00 |
Read the third row as: 80% of respondents scored below 55. Read the second row as: 55% scored below 40. That is the running total doing its job. The same logic appears in a relative frequency histogram, where bar heights show proportions instead of raw counts.
Here is the same computation in Python.
import pandas as pd
df = pd.DataFrame({'score': [12, 15, 18, 22, 24, 27, 29, 31, 33, 35, 38, 41, 44, 47, 50, 53, 57, 61, 66, 72]})
df['bin'] = pd.cut(df['score'], bins=[10, 25, 40, 55, 75],
                   labels=['10-24', '25-39', '40-54', '55-74'], right=False)
freq = df['bin'].value_counts().reindex(['10-24', '25-39', '40-54', '55-74'])
rel = freq / freq.sum()
cum = rel.cumsum()
print(pd.DataFrame({'freq': freq, 'rel': rel, 'cum': cum}))
Output:
  Bin  Frequency  Relative Frequency  Cumulative Relative Frequency
10-24          5                0.25                           0.25
25-39          6                0.30                           0.55
40-54          5                0.25                           0.80
55-74          4                0.20                           1.00
Other Ways to Do It
Spreadsheet. Put frequencies in one column and $n$ in a single cell. Compute relative frequency with a formula like =B2/$B$6, then compute the first cumulative value as the first relative frequency and each later one as the previous cumulative value plus the current relative frequency. Lock the $n$ cell with dollar signs so it does not shift when you fill down.
Cumulative frequency first. If you already have a cumulative frequency column, divide each entry by $n$ to get cumulative relative frequency directly [2]. This avoids a second addition pass and is often faster in a spreadsheet.
Software. Most stats packages give you a cumulative sum function. In Python, cumsum() on the relative frequency series does the whole column in one line, as shown above. The same idea works in R with cumsum().
Percentages. Multiply every cumulative value by 100 if your audience prefers percent. The final row becomes 100%. Keep the underlying decimals if you plan to do more math with the column.
Troubleshooting
The last value is not exactly 1. Rounding is the usual cause. If you rounded each relative frequency to two decimals before adding, small errors pile up [1]. Add the unrounded values, then round the result.
The frequencies do not sum to $n$. A value was counted twice or missed. Check boundary cases first, since those are the most common source of double counting.
A bin is empty. That is fine. Its relative frequency is 0, and its cumulative value simply repeats the row above.
The cumulative column jumps unevenly. That reflects uneven bin widths or a skewed distribution. It is a property of the data, not an error.
Your column decreases. Cumulative relative frequency can never go down. A decrease means a negative or mistyped relative frequency somewhere above.
Common Mistakes
- Dividing by the wrong total. Use the sum of all frequencies, not the count of bins or the largest frequency. Fix: compute $n$ once and reference that single cell or variable everywhere.
- Restarting the addition each row. Cumulative means running total, so each row includes everything above it. Fix: always add the previous cumulative value, not just the current relative frequency.
- Rounding too early. Rounding each relative frequency to one decimal before summing can push the final value off 1. Fix: keep full precision during the addition and round only for display.
- Overlapping or gapped bins. Bins that share an endpoint or leave a gap make some values ambiguous. Fix: define each bin as left-closed and right-open, and confirm the bins cover the full range.
- Reading the row as "exactly this bin." The cumulative column is at or below the bin's upper bound, not inside the bin. Fix: use the relative frequency column when you want a single bin's share.
- Forgetting that the last row is a check. If it is not 1.0000, something upstream is wrong. Fix: treat that value as a validation step before you report anything.
Limitations
Cumulative relative frequency depends entirely on how you define the bins. Change the bin width or the boundary rule and the running totals shift, even though the raw data has not changed. Two analysts can produce different cumulative columns from the same dataset and both be correct under their own binning.
It also hides detail inside bins. A cumulative value of 0.80 tells you the share below a cutoff, not how values are spread within each interval. If you need the shape of the distribution, pair this column with a histogram or with the mean and standard deviation. For spread, see how to calculate standard deviation, and for the center, see how to calculate the mean.
Frequently Asked Questions
What is the difference between relative frequency and cumulative relative frequency?
Relative frequency is the share of the data in one bin. Cumulative relative frequency is the share in that bin plus every bin below it [2]. The relative column sums to 1 across all rows. The cumulative column rises to 1 and stays there.
Why does the last cumulative relative frequency equal 1?
Because every observation has been counted by the time you reach the final bin, so the accumulated proportion is the whole dataset [1]. If your last value is 0.99 or 1.01, rounding is the likely cause, and the fix is to add unrounded values.
Can cumulative relative frequency be greater than 1?
No. It is a proportion of the total, so it cannot exceed 1. A value above 1 means a frequency was counted twice, a bin overlaps another, or $n$ is too small.
How do I find the median from a cumulative relative frequency table?
Find the first row where the cumulative value reaches or passes 0.50. The median falls inside that bin. You can report the bin as the median class, or interpolate within it if you need a single number.
Does the order of the rows matter?
Yes. Cumulative relative frequency only makes sense when the bins are ordered from smallest to largest. Sorting the table by frequency instead of by bin value breaks the running total and makes the column meaningless.
Can I compute this from a cumulative frequency column?
Yes. Divide each cumulative frequency by $n$ to get the cumulative relative frequency for that row [2]. This is often the fastest route when a cumulative frequency column already exists.
References
- 1.3 Frequency, Frequency Tables, and Levels of Measurement - Statistics | OpenStax
- 2.5.5: Cumulative Frequency and Relative Frequency - Statistics LibreTexts/02%3A_Displaying_and_Analyzing_Data_with_Graphs/2.05%3A_Graphs_of_Numeric_Data/2.5.05%3A_Cumulative_Frequency_and_Relative_Frequency)
Further Reading
- NIST/SEMATECH e-Handbook of Statistical Methods
- OpenStax. Introductory Statistics 2e
- Krzywinski M, Altman N (2013). Importance of being uncertain. Nature Methods
- Krzywinski M, Altman N (2013). Significance, P values and t-tests. Nature Methods