How to Calculate Midrange: Formula and Examples
By Dr. Zubair Khalid, DVM, MS, PhD ·
The midrange is the average of the smallest and largest values in a dataset. To find it, add the minimum and the maximum, then divide by two. This article shows you how to calculate midrange step by step, works through a real dataset of reaction times, and explains why a single extreme value can pull the result far from the rest of your data.
Quick Answer
- Formula: $\text{Midrange} = \dfrac{\min + \max}{2}$
- What you need: only two numbers, the smallest value and the largest value. Nothing else in the dataset affects the result.
- Example: for the values 11.8 and 15.3, the midrange is $(11.8 + 15.3) / 2 = 13.55$.
- Best use: a fast, rough center for symmetric data with no extreme values, and a quick sanity check on a range.
- Main weakness: it ignores every value except two, so one outlier can move it a long way.
The Formula
The midrange formula is:
$$\text{Midrange} = \frac{\min + \max}{2}$$
Each symbol means the following.
| Symbol | Meaning |
|---|---|
| $\min$ | The smallest value in the dataset |
| $\max$ | The largest value in the dataset |
| $\div 2$ | Divides the sum to give the midpoint between the two extremes |
The midrange is exactly the midpoint of the range, which is the distance from the minimum to the maximum. If you already know the range, you can also write the midrange as $\min + \frac{\text{range}}{2}$.
Because the formula uses only two values, you can compute it by hand for any dataset, no matter how many rows it has. That speed is the main reason it appears in quality control, weather summaries, and quick exploratory checks.
How to Calculate It Step by Step
- List your data. Write out every value in the dataset, or open the column in your spreadsheet.
- Find the minimum. Scan for the smallest number. In a spreadsheet,
MINdoes this for you. - Find the maximum. Scan for the largest number. In a spreadsheet,
MAXdoes this for you. - Add them together. Compute $\min + \max$.
- Divide by 2. The result is the midrange.
- Check the units. The midrange carries the same unit as your data, so seconds stay seconds and dollars stay dollars.
If your data is grouped into classes, the midrange uses the smallest lower class limit and the largest upper class limit. That is a related skill covered in how to calculate class width.
Worked Example
The dataset below holds ten lab reaction times in seconds, recorded from a single instrument run.
| reaction_time_s |
|---|
| 12.4 |
| 13.1 |
| 11.8 |
| 14.2 |
| 12.9 |
| 13.5 |
| 12.1 |
| 15.3 |
| 13.0 |
| 12.7 |
Step 1. Count the values. There are $n = 10$ reaction times.
Step 2. Find the minimum. The smallest value is $\min = 11.8$ seconds.
Step 3. Find the maximum. The largest value is $\max = 15.3$ seconds.
Step 4. Apply the formula.
$$\text{Midrange} = \frac{11.8 + 15.3}{2} = \frac{27.1}{2} = 13.5500$$
The midrange is 13.55 seconds.
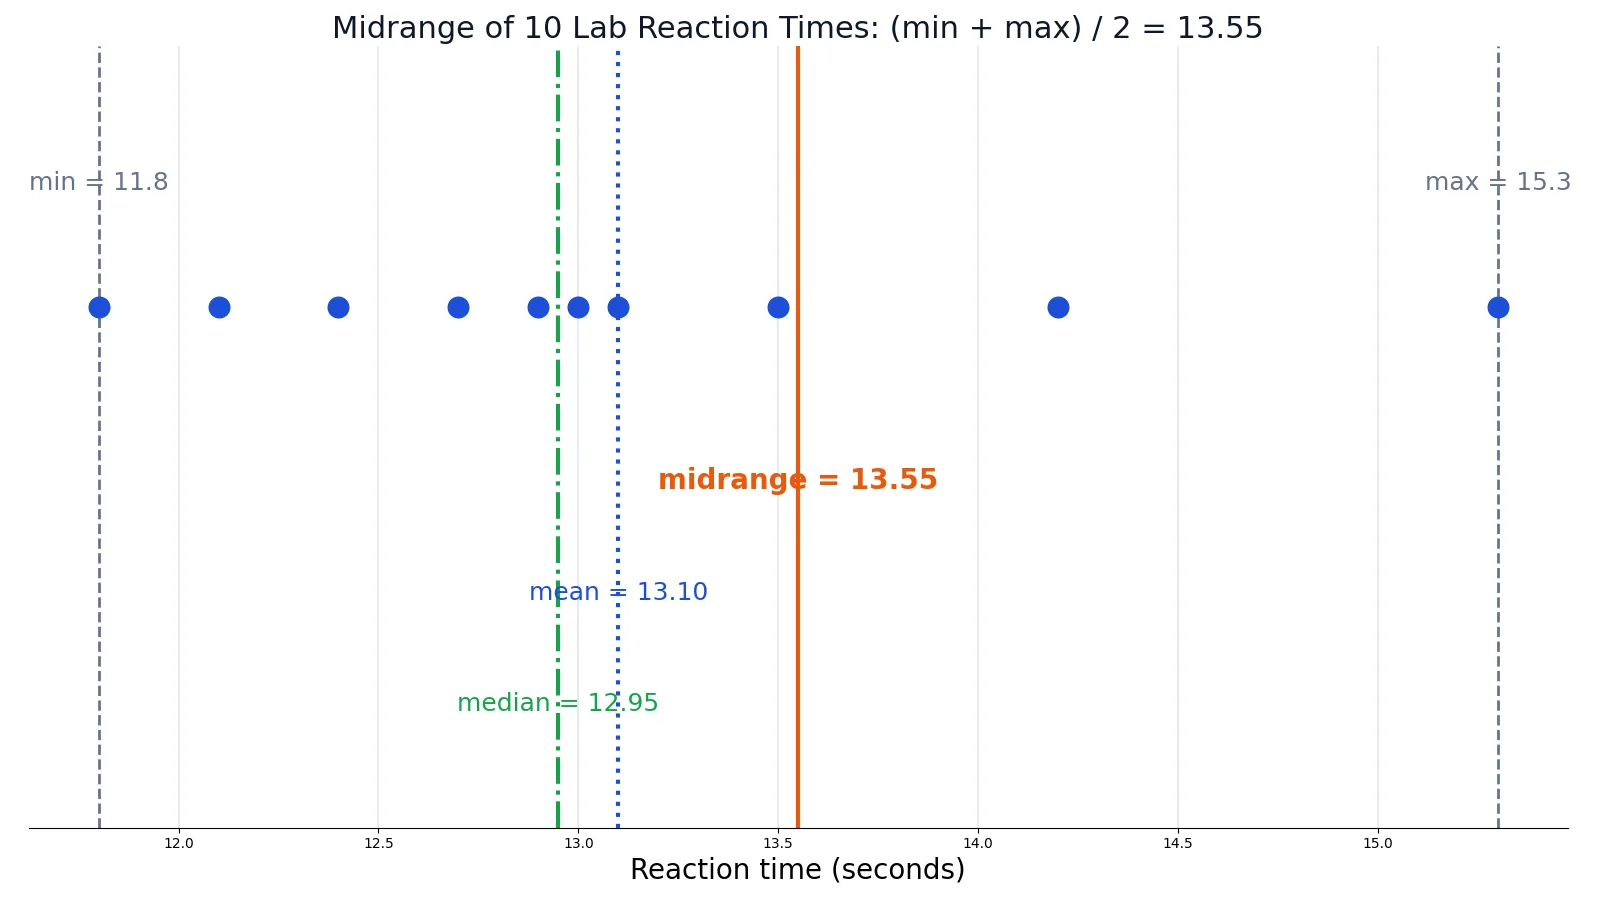
For context, the same dataset has a mean of 13.1000 seconds and a median of 12.9500 seconds. The midrange sits above both because the maximum, 15.3, is farther from the bulk of the data than the minimum, 11.8. The dot plot below shows the three measures on the same axis.
| Measure | Value (seconds) |
|---|---|
| Minimum | 11.8 |
| Maximum | 15.3 |
| Midrange | 13.5500 |
| Mean | 13.1000 |
| Median | 12.9500 |
How to Interpret the Result
The midrange is a measure of center, so it answers the question "what is a typical value?" in a very rough way. It tells you the halfway point between the two most extreme observations.
Compare it with the mean and the median. When the three values sit close together, the data is roughly symmetric and the midrange is a reasonable quick summary. When the midrange is far from the median, the data is skewed or contains an extreme value, and the midrange is the least trustworthy of the three.
In the reaction time example, the midrange of 13.55 is 0.60 seconds above the median of 12.95. That gap is a signal that the upper tail is stretched. The mean of 13.10 sits between them, which is typical for a mildly right-skewed dataset.
A practical use is a fast check on a measurement process. If you know the acceptable operating window for a machine, the midrange tells you the center of the observed window in one calculation. It is also the natural companion to the range when you report spread and center together.
Doing It in Software
Excel. If your ten reaction times sit in cells A2 through A11, the formula is:
=(MIN(A2:A11)+MAX(A2:A11))/2This returns 13.55. The MIN and MAX functions ignore empty cells and text, so a stray label in the column will not break the result. If you want the output rounded for display, wrap it in ROUND, which is explained in the Excel ROUND function guide.
Python. The built-in min and max functions work on any list of numbers.
import statistics
times = [12.4, 13.1, 11.8, 14.2, 12.9, 13.5, 12.1, 15.3, 13.0, 12.7]
midrange = (min(times) + max(times)) / 2
print(f"{midrange:.4f}")  # 13.5500
Output:
13.5500R. The same idea uses min and max on a numeric vector.
times <- c(12.4, 13.1, 11.8, 14.2, 12.9, 13.5, 12.1, 15.3, 13.0, 12.7)
(midrange <- (min(times) + max(times)) / 2)
Output:
[1] 13.55All three tools give the same answer because the formula has no hidden options. If you need the mean or variance instead, the steps are longer and are covered in how to calculate variance.
Common Mistakes
- Using the mean of the first and last row instead of min and max. If your data is unsorted, the first and last rows are arbitrary. Always compute the true minimum and maximum, or let
MINandMAXdo it. - Forgetting to divide by 2. The sum $\min + \max$ is the range's endpoints added together, not the center. Dividing is what produces the midpoint.
- Confusing midrange with median. The median is the middle value after sorting and uses every observation's position. The midrange uses only two values. They agree only in special cases.
- Confusing midrange with the midpoint of a frequency class. For grouped data, the class midpoint is the average of a single class's limits. The midrange spans the whole dataset.
- Leaving a data entry error in the column. A typo such as 153 instead of 15.3 becomes the maximum and shifts the midrange by roughly 69 seconds. Clean the data before you compute.
- Reporting the midrange without the range. The midrange alone hides how wide the data is. Report both, or report the midrange next to the mean and median.
Limitations
The midrange is the least stable common measure of center. It depends on exactly two observations, so it throws away all the information in the middle of the distribution. A single outlier, a recording error, or one unusually slow reaction can move it by a large amount while the median barely changes. For the reaction times above, changing only the maximum from 15.3 to 30.0 would push the midrange from 13.55 to 20.90, even though nine of the ten values are unchanged.
Because of that sensitivity, the midrange is a poor choice for formal statistical inference. It has no role in confidence intervals, hypothesis tests, or regression. Use it for quick summaries, for symmetric data with no extreme values, and as a teaching tool for showing how outliers behave. For anything where the center must be reliable, use the mean or the median. If you need to estimate a population value from a sample, a proper point estimate is the right approach.
Frequently Asked Questions
What is the midrange formula?
The midrange formula is $(\min + \max) / 2$, where min is the smallest value and max is the largest value in the dataset. Add the two extremes and divide by two. The result is the midpoint of the range.
Can the midrange be a value that is not in the dataset?
Yes, and it usually is. The midrange is an average of two values, so it lands between them and rarely matches an actual observation. In the reaction time example, 13.55 seconds does not appear in the data, though 13.5 and 13.1 do.
Why is the midrange sensitive to outliers?
It uses only the minimum and maximum, so any value that becomes the new extreme changes the result directly. The other observations have no influence at all. A single data entry error at the top or bottom of the column can shift the midrange substantially.
When should I use the midrange instead of the mean or median?
Use it when you want a fast, rough center and the data is symmetric with no extreme values. It is also useful as a quick check on the span of a process. For skewed data, for data with outliers, or for any formal analysis, use the mean or the median instead.
How do I find the midrange for grouped data?
Use the smallest lower class limit as the minimum and the largest upper class limit as the maximum, then apply the same formula. For example, if the classes run from 10 to 19 up to 50 to 59, the midrange is $(10 + 59) / 2 = 34.5$. This is a different calculation from finding a single class midpoint, which is covered in mean of interval.
References
This article draws on the standard references listed under Further Reading.
Further Reading
- NIST/SEMATECH e-Handbook of Statistical Methods
- OpenStax. Introductory Statistics 2e
- Krzywinski M, Altman N (2013). Importance of being uncertain. Nature Methods
- Krzywinski M, Altman N (2013). Significance, P values and t-tests. Nature Methods
- Wasserstein RL, Lazar NA (2016). The ASA Statement on p -Values: Context, Process, and Purpose. The American Statistician
- Greenland S, Senn SJ, Rothman KJ et al. (2016). Statistical tests, P values, confidence intervals, and power: a guide to misinterpretations. European Journal of Epidemiology