How to Calculate the Mean: Formula and Step by Step Examples
By Dr. Zubair Khalid, DVM, MS, PhD ·
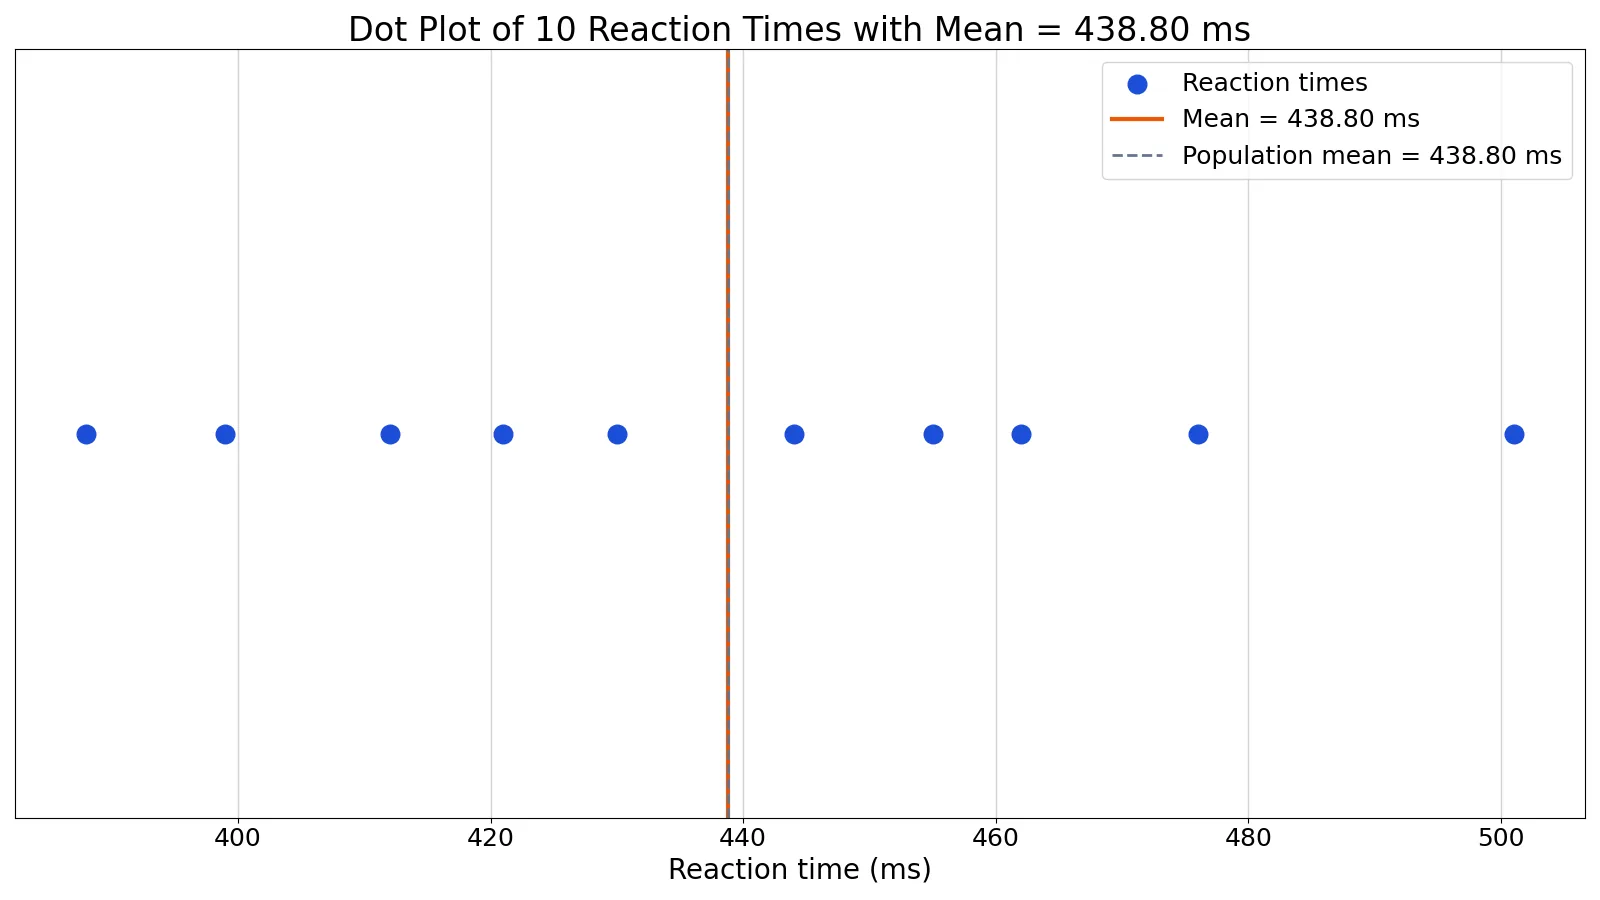
To calculate the mean, add every value in a dataset and divide the sum by the number of values. That single number, the arithmetic mean, summarizes the center of your data. This article shows the formula, walks through a full example, and covers the sample mean and population mean so you can compute either one correctly.
Quick Answer
- The mean formula is $\bar{x} = \frac{\sum x}{n}$ for a sample and $\mu = \frac{\sum x}{N}$ for a population.
- $\sum x$ means "add up all the values." $n$ or $N$ is how many values you have.
- The arithmetic mean is the balance point of the data. It is the value where the deviations above and below cancel out.
- Sample and population means use the same arithmetic. Only the symbol and the count label change.
- For the reaction-time dataset below, the mean is 438.80 ms.
The Formula
The mean, also called the arithmetic mean, is the sum of all observations divided by the count of observations.
$$\bar{x} = \frac{\sum_{i=1}^{n} x_i}{n}$$
Each symbol has a specific job:
| Symbol | Meaning |
|---|---|
| $\bar{x}$ | Sample mean, read as "x-bar" |
| $\mu$ | Population mean, read as "mu" |
| $\sum$ | Summation sign, meaning "add all of these" |
| $x_i$ | The i-th value in the dataset |
| $n$ | Number of values in a sample |
| $N$ | Number of values in a population |
The population version is written the same way with different labels:
$$\mu = \frac{\sum_{i=1}^{N} x_i}{N}$$
The meaning of arithmetic mean is simple: it is the total spread evenly across every observation. If ten people each had the same value, that shared value would be the mean.
How to Calculate It Step by Step
- Write down every value. Keep the original units, such as milliseconds, dollars, or centimeters.
- Count the values. This count is $n$ for a sample or $N$ for a population.
- Add all the values. This gives $\sum x$.
- Divide the sum by the count. The result is the mean.
- Attach the unit. A mean of 438.8 in a reaction-time study means 438.8 milliseconds, not a bare number.
If you are working in a spreadsheet, the process is the same but the arithmetic is automatic. See how to calculate the mean in Excel for the function and menu steps.
Worked Example
A researcher records ten reaction times in milliseconds from a simple reaction-time task. Here is the dataset.
| Trial | Reaction time (ms) |
|---|---|
| 1 | 412 |
| 2 | 388 |
| 3 | 501 |
| 4 | 455 |
| 5 | 430 |
| 6 | 476 |
| 7 | 399 |
| 8 | 444 |
| 9 | 462 |
| 10 | 421 |
Step 1. List the values.
412, 388, 501, 455, 430, 476, 399, 444, 462, 421
Step 2. Count them.
$n = 10$
Step 3. Sum them.
$\sum x = 4388$
Step 4. Divide.
$$\bar{x} = \frac{4388}{10} = 438.8000$$
The sample mean is 438.80 ms.
Step 5. Population mean. If these ten trials were the entire population of interest, the calculation is identical.
$$\mu = \frac{4388}{10} = 438.8000$$
The population mean is also 438.80 ms. The number is the same because the arithmetic does not change. What changes is the notation and how you describe the result.
For context, the sample standard deviation is $s = 35.5240$ ms and the population standard deviation is $\sigma = 33.7010$ ms. Those values describe spread, not center, and they use different divisors. The standard deviation guide explains why the sample version divides by $n-1$.
How to Interpret the Result
A mean of 438.80 ms tells you the typical reaction time in this set of ten trials. It does not tell you that every trial took 438.80 ms. Individual trials ranged from 388 ms to 501 ms.
The mean is sensitive to every value. One unusually slow trial pulls it upward. One unusually fast trial pulls it downward. That sensitivity is a feature when the data are roughly symmetric and a problem when they are not.
Compare the mean with the median when you have skewed data. If the mean and median sit far apart, the distribution is lopsided and the mean may not represent a typical case well. A mean, median and mode calculator lets you check all three at once.
The mean is also the input to many other statistics. Variance, standard deviation, z-scores, and confidence intervals all start from it. The variance formula uses the mean as its reference point.
Doing It in Software (Excel, R or Python)
In Excel, the AVERAGE function returns the mean of a range. If the ten values sit in cells A1 through A10, the formula is =AVERAGE(A1:A10).
In R, the mean function does the same job. For a vector named data, you write mean(data).
In Python, the statistics module provides mean. Here is the full calculation for this dataset.
import statistics
data = [412, 388, 501, 455, 430, 476, 399, 444, 462, 421]
mean = statistics.mean(data)
Output:
mean = 438.8000The statistics.mean function works on any sequence of numbers, including a list, a tuple, or a generator. For large numeric datasets, NumPy's mean is faster, but the result is the same arithmetic.
If you are computing a mean across several groups, the grand mean formula shows how to combine group means correctly. Combining them by averaging the averages is only valid when the groups are the same size.
Common Mistakes
- Dividing by the wrong count. Use $n$ for a sample and $N$ for a population. The arithmetic is identical, but the label matters when you report the result. Fix: state clearly which one you computed.
- Forgetting to include every value. A dropped observation changes both the sum and the count. Fix: count the values before and after summing, and confirm the two match.
- Averaging averages from unequal groups. The mean of group means is not the overall mean unless every group has the same size. Fix: weight each group mean by its count, or pool the raw values.
- Treating the mean as a typical value in skewed data. Income and house prices are common examples. Fix: report the median alongside the mean.
- Mixing units. Adding seconds to milliseconds produces a meaningless sum. Fix: convert everything to one unit before summing.
- Rounding too early. Rounding intermediate sums can shift the final answer. Fix: keep full precision until the last step.
Limitations
The mean compresses an entire dataset into one number, so it hides the shape of the distribution. Two datasets with the same mean can look completely different. One might cluster tightly around the center, the other might have values spread across a wide range. Always pair the mean with a measure of spread such as the standard deviation or the range.
The mean is also not resistant to outliers. A single extreme value can move it far from the bulk of the data. When your data are skewed or contain errors, the median often describes the center better. The mean remains the right choice when you need a value that uses all the information in the dataset, or when you are computing statistics that depend on it, such as variance and the standard error.
Frequently Asked Questions
How do you find the mean of a set of numbers?
Add all the numbers together, then divide by how many numbers there are. For the values 2, 4, and 6, the sum is 12 and the count is 3, so the mean is 4. The same two steps work for any dataset, large or small.
What is the difference between the sample mean and the population mean?
The sample mean, written $\bar{x}$, is computed from a subset of a larger group. The population mean, written $\mu$, is computed from every member of the group. The formula is the same. The difference is what the number represents and how much uncertainty surrounds it. A sample mean is an estimate of the population mean.
Can the mean be a number that is not in the dataset?
Yes. The mean is a computed summary, not an observed value. In the reaction-time example, 438.80 ms does not appear in the data, yet it is the correct mean. This is normal and expected for most datasets.
How do you find the mean of a vector?
A vector is an ordered list of numbers, so the process is identical. Sum the components and divide by the number of components. In Python, statistics.mean accepts a list or tuple. In R, mean accepts a numeric vector.
What is the mean of a histogram?
You estimate it by treating each bin's midpoint as the value for every observation in that bin. Multiply each midpoint by its frequency, sum those products, and divide by the total frequency. The histogram mean guide walks through the calculation with an example.
References
This article draws on the standard references listed under Further Reading.
Further Reading
- NIST/SEMATECH e-Handbook of Statistical Methods
- OpenStax. Introductory Statistics 2e
- Krzywinski M, Altman N (2013). Importance of being uncertain. Nature Methods
- Krzywinski M, Altman N (2013). Significance, P values and t-tests. Nature Methods
- Wasserstein RL, Lazar NA (2016). The ASA Statement on p -Values: Context, Process, and Purpose. The American Statistician
- Greenland S, Senn SJ, Rothman KJ et al. (2016). Statistical tests, P values, confidence intervals, and power: a guide to misinterpretations. European Journal of Epidemiology
Related Articles
- How to Calculate the Mean in Excel (Step by Step)
- How to Calculate Variance: Formula, Steps and Examples
- Sample Mean: Definition, Formula and Examples
- How to Calculate Standard Deviation: Formula and Steps
- How to Find the Mean From a Histogram (With Examples)
- Test Statistic Formula: How to Calculate and Use It