How to Calculate Standard Deviation: Formula and Steps
By Dr. Zubair Khalid, DVM, MS, PhD ·
To compute the standard deviation, subtract the mean from each value, square the differences, average them, and take the square root. The only real decision is the denominator: use $n$ for a population and $n - 1$ for a sample. This guide gives you both formulas and a full worked example.
Quick Answer
- The standard deviation measures how far values typically sit from their mean [n:1].
- Population formula: $\sigma = \sqrt{\frac{\sum (x - \mu)^2}{N}}$.
- Sample formula: $s = \sqrt{\frac{\sum (x - \bar{x})^2}{n - 1}}$.
- The steps are identical except for the denominator, so the sample result is always slightly larger [n:2].
- A small standard deviation means values cluster near the mean, and a large one means they spread out [n:3].
The Formula
For a population, the standard deviation is:
$$\sigma = \sqrt{\frac{\sum_{i=1}^{N}(x_i - \mu)^2}{N}}$$
For a sample, it is:
$$s = \sqrt{\frac{\sum_{i=1}^{n}(x_i - \bar{x})^2}{n - 1}}$$
Each symbol means the same thing in both:
| Symbol | Meaning |
|---|---|
| $x_i$ | Each individual data value |
| $\mu$ or $\bar{x}$ | The mean of the data |
| $x_i - \mu$ | The deviation of a value from the mean |
| $(x_i - \mu)^2$ | The squared deviation |
| $\sum$ | Sum of all the squared deviations |
| $N$ or $n$ | The number of values |
| $\sigma$ or $s$ | The standard deviation |
The numerator, the sum of squared deviations, is often abbreviated SS. The quantity under the square root is the variance, so the standard deviation is simply the square root of the variance [n:2]. If you want to see how that intermediate value is built, the guide on how to calculate variance covers it in detail.
The difference between the two formulas is the denominator. Dividing by $n - 1$ instead of $n$ corrects a bias that appears when you estimate a population spread from a sample. This adjustment is known as Bessel's correction [n:5].
How to Calculate It Step by Step
- Count your values. Find $n$, the number of data points.
- Find the mean. Add every value and divide by $n$.
- Subtract the mean from each value. These are the deviations.
- Square each deviation. Squaring removes the signs so positive and negative gaps do not cancel.
- Add the squared deviations. This gives SS.
- Divide. Use $n$ for a population or $n - 1$ for a sample.
- Take the square root. The result is the standard deviation.
Steps 1 through 5 are the same for both formulas. Only step 6 changes [n:2].
Worked Example
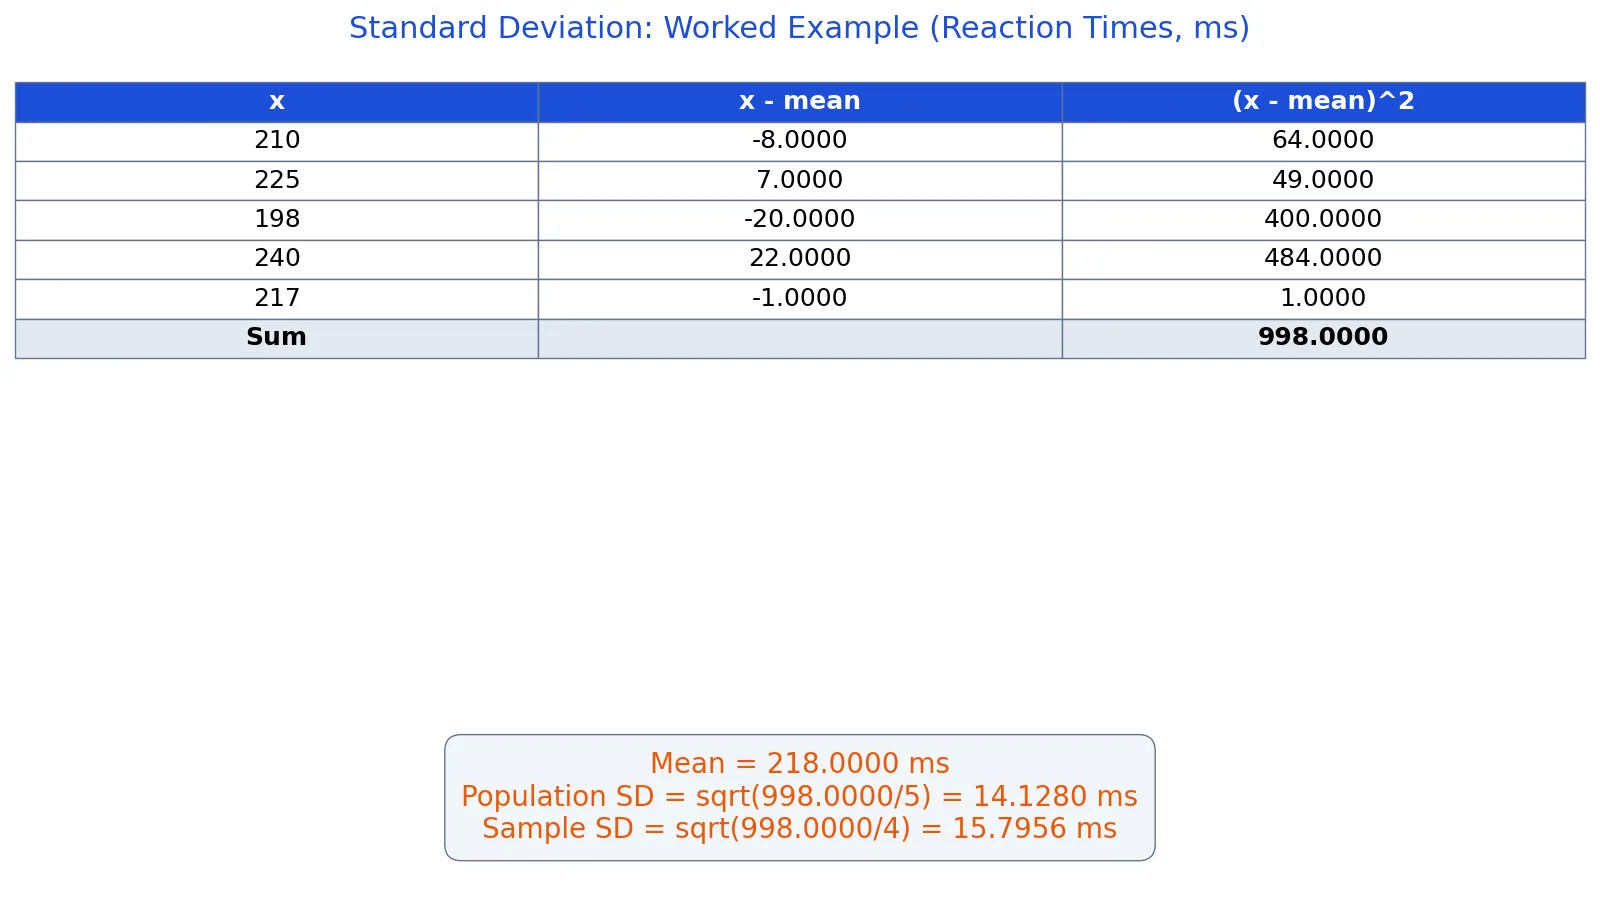
Suppose you recorded five reaction time measurements in milliseconds: 210, 225, 198, 240, and 217.
| Value | Deviation ($x - \bar{x}$) | Squared deviation |
|---|---|---|
| 210 | -8.0000 | 64.0000 |
| 225 | 7.0000 | 49.0000 |
| 198 | -20.0000 | 400.0000 |
| 240 | 22.0000 | 484.0000 |
| 217 | -1.0000 | 1.0000 |
Step 1. Count the values. $n = 5$.
Step 2. Find the mean.
$$(210 + 225 + 198 + 240 + 217) / 5 = 218.0000$$
Step 3. Subtract the mean from each value. The deviations are -8.0000, 7.0000, -20.0000, 22.0000, and -1.0000. They sum to zero, which is a useful check.
Step 4. Square each deviation. You get 64.0000, 49.0000, 400.0000, 484.0000, and 1.0000.
Step 5. Add the squared deviations.
$$64.0000 + 49.0000 + 400.0000 + 484.0000 + 1.0000 = 998.0000$$
Step 6a. Population variance. Divide by $n = 5$.
$$998.0000 / 5 = 199.6000$$
Step 7a. Population standard deviation.
$$\sqrt{199.6000} = 14.1280$$
Step 6b. Sample variance. Divide by $n - 1 = 4$.
$$998.0000 / 4 = 249.5000$$
Step 7b. Sample standard deviation.
$$\sqrt{249.5000} = 15.7956$$
So the population standard deviation is 14.1280 ms and the sample standard deviation is 15.7956 ms. The sample value is larger because dividing by 4 instead of 5 produces a bigger variance before the square root.
How to Interpret the Result
The standard deviation is expressed in the same units as your data, so 14.1280 ms is a time, not a squared time. That makes it easier to read than variance, which is in squared units.
A value of 14.1280 ms means a typical reaction time in this set sits roughly 14 ms away from the 218 ms mean. A small standard deviation means the values cluster tightly around the mean, and a large one means they are spread over a wider range [n:3].
If the data follow a normal distribution, about 68% of values fall within one standard deviation of the mean, about 95% within two, and about 99.7% within three [n:3]. For the reaction times, that would put roughly two thirds of measurements between about 204 ms and 232 ms.
One caution: the standard deviation of your data is not the same as the standard error of the mean. The standard error describes how much a sample mean would vary across repeated samples, and it equals the population standard deviation divided by the square root of the sample size [n:1]. The comparison in standard deviation vs variance vs standard error explains when to report each one.
Doing It in Software
Spreadsheets and programming languages handle the arithmetic for you, but you still have to pick the right function. In Excel, STDEV.P returns the population standard deviation and STDEV.S returns the sample standard deviation. The walkthrough in how to calculate standard deviation in Excel shows both with a real sheet.
In Python, the statistics module gives you the same split.
import statistics
data = [210, 225, 198, 240, 217]
mean = statistics.mean(data)
pop_sd = statistics.pstdev(data)
samp_sd = statistics.stdev(data)
print(f"pop_sd = {pop_sd:.4f}, samp_sd = {samp_sd:.4f}")
Output:
pop_sd = 14.1280, samp_sd = 15.7956The two functions match the hand calculation exactly. If you would rather skip the code, the Standard Deviation Calculator takes a list of values and returns both figures.
Common Mistakes
- Using $n$ when you have a sample. This understates the spread. Use $n - 1$ whenever your data is a sample drawn from a larger group [n:2].
- Forgetting to square the deviations. Unsquared deviations sum to zero, so the calculation collapses. Square each one before adding.
- Taking the square root too early. The square root comes last, after dividing by $n$ or $n - 1$.
- Mixing up variance and standard deviation. Variance is the value under the square root. Standard deviation is its square root, in the original units.
- Confusing standard deviation with standard error. They measure different things, and the standard error shrinks as sample size grows [n:1].
- Applying it to the wrong data type. Standard deviation is meaningless for nominal data such as country or biological sex, and it should not be used with ordinal data [n:4].
Limitations
The standard deviation assumes your data have a meaningful numeric scale and a center worth measuring. For skewed data or data with extreme outliers, a single value can be misleading because one large observation inflates the result. In those cases the interquartile range often describes the spread better [n:4].
It also says nothing about the shape of the distribution. Two datasets can share the same mean and standard deviation while looking completely different. Treat it as one summary of spread, not a full description of your data.
Frequently Asked Questions
How can I find standard deviation if I only have the mean and one value?
You cannot. The standard deviation depends on how far every value sits from the mean, so you need the full set of observations or a summary that already includes the spread, such as the sum of squared deviations.
Should I use the population or sample formula?
Use the population formula when your data include every member of the group you care about. Use the sample formula when your data are a subset used to estimate a larger population [n:2]. In practice, most research data are samples.
Why is the sample standard deviation always larger?
Dividing by $n - 1$ instead of $n$ makes the denominator smaller, so the variance is larger before you take the square root. This correction accounts for the fact that a sample tends to underestimate the true spread of the population [n:5].
Can the standard deviation be zero?
Yes. If every value in the dataset is identical, each deviation is zero, the sum of squared deviations is zero, and the standard deviation is zero. A value close to zero means the data points sit very close to the mean [n:3].
How do I figure out standard deviation from a frequency table?
Multiply each squared deviation by its frequency, add those products to get the sum of squared deviations, then divide by the total count and take the square root. The steps are the same, but each deviation is weighted by how often it occurs.
References
This article draws on the standard references listed under Further Reading.
Further Reading
- Standard deviation - Wikipedia
- 4.6 - Calculating Standard Deviation - Introduction to Statistics and Statistical Thinking
- Finding and Using Health Statistics
- Standard Deviation
- Standard Deviation
- NIST/SEMATECH e-Handbook of Statistical Methods
Related Articles
- How to Calculate Standard Deviation in Excel
- How to Calculate the Mean: Formula and Step by Step Examples
- How to Calculate Variance: Formula, Steps and Examples
- How to Calculate the Mean in Excel (Step by Step)
- Standard Deviation of a Binomial Distribution: Formula and Example
- Sample size standard deviation formula
- Test Statistic Formula: How to Calculate and Use It
- Standard Deviation vs Variance vs Standard Error: What Each Measures and When to Report It