How to Calculate Cumulative Frequency (Step by Step)
By Dr. Zubair Khalid, DVM, MS, PhD ·
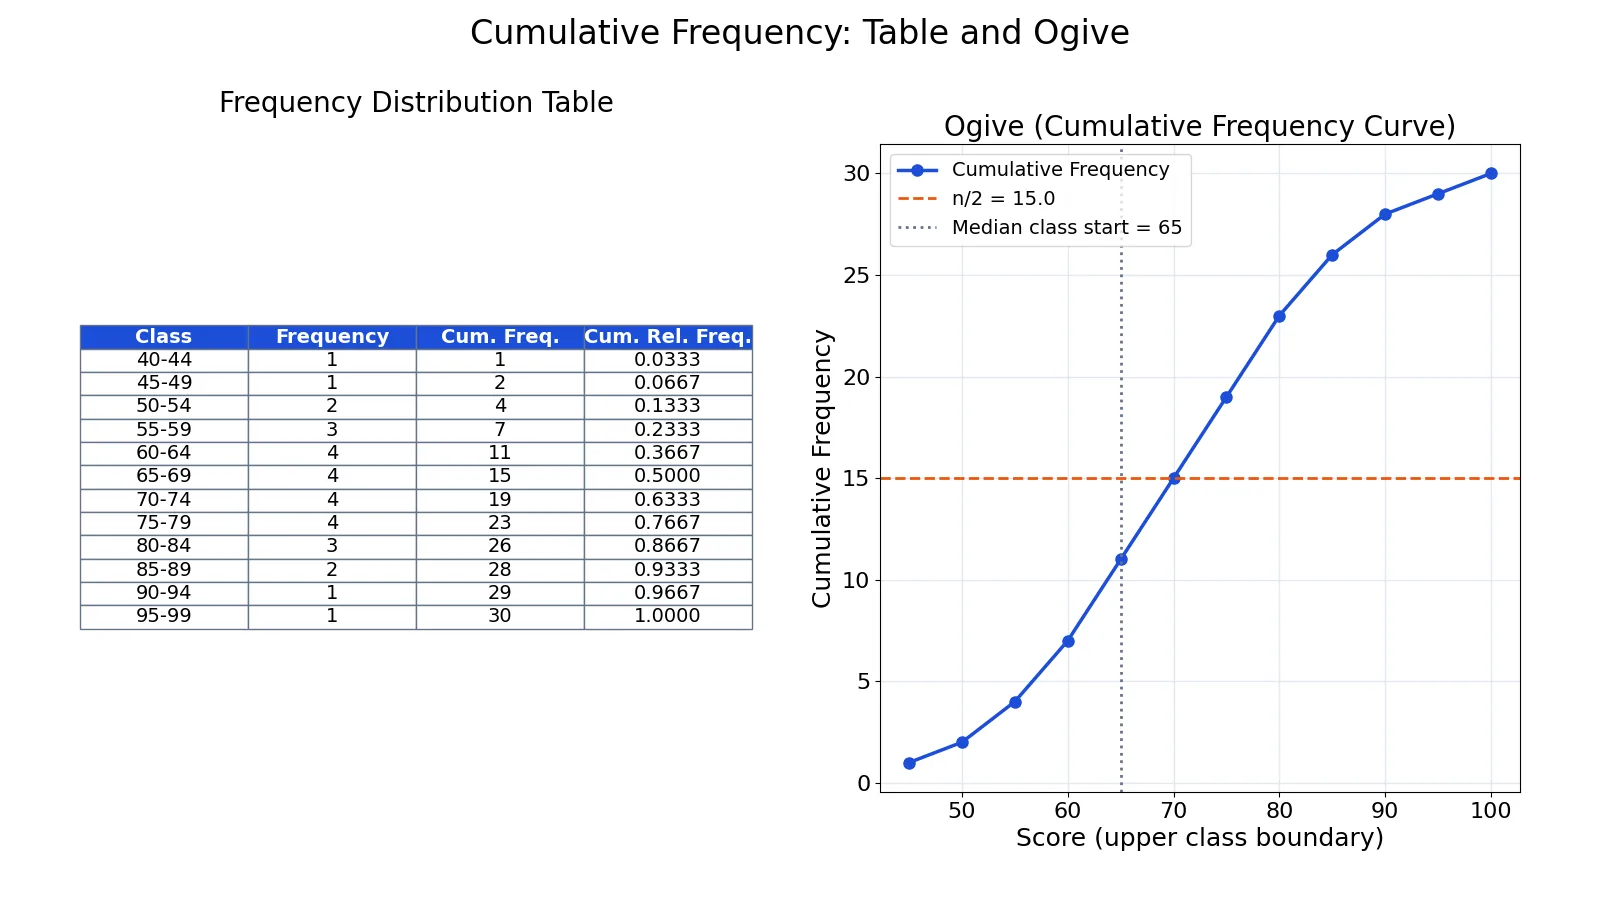
Cumulative frequency is the running total of frequencies as you move down a frequency table. It tells you how many observations fall at or below the upper limit of each class. This article shows you how to calculate cumulative frequency from raw data, how to add a cumulative relative frequency column, and how to read the result.
Quick Answer
- Sort or bin your data into classes, then count how many values fall in each class. That count is the frequency $f$.
- Cumulative frequency (CF) for a class = the frequency of that class plus the cumulative frequency of the class above it.
- The first class CF equals its own frequency. The last class CF equals the total number of observations, $n$.
- Cumulative relative frequency (CRF) = CF divided by $n$. The last CRF should be 1.0000, or very close to it after rounding [1].
- You can build the whole table by hand, in a spreadsheet, or in Python with
cumsum().
Before You Start
You need two things: the raw data and a set of classes. Classes are equal-width intervals such as 40-44, 45-49, 50-54. Each value must fall into exactly one class, so the intervals should not overlap.
Decide the class width before you count anything. A common starting point is somewhere between 5 and 20 classes depending on how much data you have. For 30 values, 12 classes of width 5 works well. If you are building the table in a spreadsheet, the same counting logic applies as in any frequency table in Excel.
Two definitions carry the whole method:
$$f_i = \text{number of observations in class } i$$
$$CF_i = f_1 + f_2 + \cdots + f_i$$
The second formula is the running total. You never need to re-add the whole column, just add the current frequency to the previous cumulative value.
Step by Step
- List the classes in order. Write them from smallest to largest, for example 40-44, 45-49, and so on up to the largest value.
- Count the frequency of each class. Tally how many raw values fall inside each interval. Write that number in the frequency column.
- Check the total. Add the frequency column. It must equal $n$, the number of observations. If it does not, you have missed a value or double-counted one.
- Set the first cumulative frequency. For the top class, $CF_1 = f_1$. There is nothing above it to add.
- Add down the column. For every later class, $CF_i = CF_{i-1} + f_i$. Each row is the previous cumulative value plus the current frequency.
- Confirm the last value. The final cumulative frequency must equal $n$. This is your built-in error check.
- Build the cumulative relative frequency column. Divide each CF by $n$: $CRF_i = CF_i / n$. The last entry should be 1.0000 [1]. Because of rounding, the relative frequency column may not sum exactly to one, and the last CRF may be slightly off from one, but both should be close [1].
- Read the table. A CF of 15 in a class means 15 observations fall at or below that class. A CRF of 0.5000 means half the data is at or below that point.
Worked Example
The dataset is 30 exam scores, binned into 5-point intervals from 40 to 100.
| Score |
|---|
| 42, 47, 51, 53, 55, 56, 58, 61, 62, 63 |
| 64, 66, 67, 68, 69, 71, 72, 73, 74, 75 |
| 76, 78, 79, 81, 83, 84, 86, 88, 91, 95 |
Here $n = 30$ and the class width is $w = 5$. Counting each class gives the frequency column, then adding down gives the cumulative frequency, then dividing by 30 gives the cumulative relative frequency.
| Class | Frequency $f$ | Cumulative Frequency | Cumulative Relative Frequency |
|---|---|---|---|
| 40-44 | 1 | 1 | 0.0333 |
| 45-49 | 1 | 2 | 0.0667 |
| 50-54 | 2 | 4 | 0.1333 |
| 55-59 | 3 | 7 | 0.2333 |
| 60-64 | 4 | 11 | 0.3667 |
| 65-69 | 4 | 15 | 0.5000 |
| 70-74 | 4 | 19 | 0.6333 |
| 75-79 | 4 | 23 | 0.7667 |
| 80-84 | 3 | 26 | 0.8667 |
| 85-89 | 2 | 28 | 0.9333 |
| 90-94 | 1 | 29 | 0.9667 |
| 95-99 | 1 | 30 | 1.0000 |
Walk through the first few rows. Class 40-44 has one score, so $CF = 1$ and $CRF = 1/30 = 0.0333$. Class 45-49 also has one score, so $CF = 1 + 1 = 2$ and $CRF = 2/30 = 0.0667$. Class 50-54 has two scores, so $CF = 2 + 2 = 4$ and $CRF = 4/30 = 0.1333$. The pattern continues until the last class, where $CF = 30$ and $CRF = 30/30 = 1.0000$.
The cumulative frequency column also locates the median. The median position is $n/2 = 30/2 = 15.0$. The first class whose CF reaches 15 is 65-69, so that is the median class. Interpolating inside it:
$$L + \left(\frac{n/2 - CF_{prev}}{f_{med}}\right) w = 65 + \left(\frac{15.0 - 11}{4}\right) 5 = 70.0000$$
So the estimated median is 70. This is the same logic used in a cumulative relative frequency table, where the CRF column replaces the CF column for the same purpose.
Here is the same table built in Python.
import pandas as pd
scores = [42, 47, 51, 53, 55, 56, 58, 61, 62, 63,
          64, 66, 67, 68, 69, 71, 72, 73, 74, 75,
          76, 78, 79, 81, 83, 84, 86, 88, 91, 95]
bins = list(range(40, 101, 5))
labels = [f'{bins[i]}-{bins[i+1]-1}' for i in range(len(bins)-1)]
df = pd.DataFrame({'score': scores})
df['class'] = pd.cut(df['score'], bins=bins, right=False, labels=labels)
freq = df['class'].value_counts().reindex(labels, fill_value=0).sort_index()
cum_freq = freq.cumsum()
cum_rel = cum_freq / len(scores)
table = pd.DataFrame({'Frequency': freq, 'Cumulative Frequency': cum_freq,
                      'Cumulative Relative Frequency': cum_rel})
print(table)
Frequency Cumulative Frequency Cumulative Relative Frequency
class
40-44 1 1 0.033333
45-49 1 2 0.066667
50-54 2 4 0.133333
55-59 3 7 0.233333
60-64 4 11 0.366667
65-69 4 15 0.500000
70-74 4 19 0.633333
75-79 4 23 0.766667
80-84 3 26 0.866667
85-89 2 28 0.933333
90-94 1 29 0.966667
95-99 1 30 1.000000Other Ways to Do It
Spreadsheet. Put the class labels in one column and the frequencies in the next. In the first cumulative cell, reference the first frequency cell directly. In the second cumulative cell, add the previous cumulative cell to the current frequency cell, then drag that formula down. For the relative column, divide each cumulative cell by the total count. If you want the mean of the same data, the steps are in how to calculate the mean.
By hand. Keep a running total on a separate line of scratch paper. Add each frequency to the running total and write the result in the CF column. This is slower but it makes the running-total idea obvious.
Statistical software. Most packages compute frequencies and cumulative counts directly. One caution from the LibreTexts frequency table chapter: some software reports percentages instead of relative frequencies, so you divide by 100 to convert [2]. Always check which column you are actually looking at.
Graphing. Plot cumulative frequency against the upper class boundary to get an ogive. The y-value for each point is the number of observations in that class plus all lower classes [3]. The ogive is the visual version of the CF column.
Troubleshooting
The last CF does not equal $n$. You missed a value or counted one twice. Recount the frequency column against the raw data.
A value falls on a class boundary. Your intervals overlap or leave a gap. Fix the class definitions so every value belongs to exactly one class.
The last CRF is 0.9999 or 1.0001. This is rounding, not an error. The relative frequency column may not sum exactly to one, and the last cumulative relative frequency may not be exactly one, but both should be close [1].
The CF column jumps by an odd amount. Check whether you added the current frequency to the previous cumulative value or accidentally added two frequencies together.
The median class looks wrong. Confirm you used $n/2$ and not $n$. For even $n$ the position is a whole number, for odd $n$ it falls between two positions.
Common Mistakes
- Starting the CF column with the second class. The first class CF always equals its own frequency. There is nothing above it.
- Adding the frequency column instead of the cumulative column. Each row is previous CF plus current $f$, not a fresh sum of all frequencies above it.
- Dividing by the wrong denominator. Cumulative relative frequency uses $n$, the total number of observations, not the number of classes and not the largest frequency.
- Forgetting to check the final value. The last CF must equal $n$ and the last CRF must be 1.0000 or very close [1]. Skipping this check hides counting errors.
- Using overlapping classes. If 65 appears in both 60-64 and 65-69, the counts are wrong. Define intervals so each value lands in one class only.
- Treating CF as a percentage. CF is a count. Only the CRF column is a proportion, and you multiply it by 100 to get a percentage.
Limitations
Cumulative frequency depends entirely on how you define the classes. Change the width or the starting point and the CF column changes, even though the raw data has not moved. Two analysts can produce two different-looking tables from the same values, so always report the class definitions alongside the table.
The method also compresses information. Once values are binned, you lose the exact positions inside each class. The median estimate of 70.0000 from the worked example is an interpolation, not the true median of the raw scores. Cumulative frequency is a summary tool, and summaries trade detail for clarity. For spread and relationship questions you need different measures, such as standard deviation or the correlation coefficient.
Frequently Asked Questions
How do you find cumulative frequency from a list of numbers?
Sort the values, group them into classes, count each class, then add the counts down the column. The first cumulative value is the first frequency. Every later value is the previous cumulative value plus the current frequency. The final value equals the number of observations.
What is the difference between frequency and cumulative frequency?
Frequency is how many values fall inside one class. Cumulative frequency is how many values fall in that class or any class below it. Frequency answers "how many here," cumulative frequency answers "how many up to here."
How do you calculate cumulative relative frequency?
Divide each cumulative frequency by the total number of observations $n$. If the cumulative frequency is 15 and $n$ is 30, the cumulative relative frequency is $15/30 = 0.5000$. The last entry should be 1.0000, or close to it after rounding [1].
What should the last cumulative frequency be?
It should equal $n$, the total number of observations. In the worked example, the last cumulative frequency is 30 because there are 30 exam scores. If your last value does not match $n$, recount the frequency column.
Can cumulative frequency be used to find the median?
Yes. Find $n/2$, then locate the first class whose cumulative frequency reaches or passes that position. That is the median class. Interpolating inside the class gives an estimate of the median, as shown in the worked example where the estimate is 70.0000.
References
- Frequency, Frequency Tables, and Levels of Measurement - Introductory Statistics
- 2.1: Frequency Tables - Statistics LibreTexts/02%3A_Descriptive_Statistics_-_Frequency_Data_(Counting)/2.01%3A_Frequency_Tables)
- 2.2.5: Frequency Polygons - Statistics LibreTexts/02%3A_Descriptive_Statistics/2.02%3A_Graphing_Distributions/2.2.05%3A_Frequency_Polygons)
Further Reading
- 2: Frequency Distributions and Graphs - Statistics LibreTexts
- NIST/SEMATECH e-Handbook of Statistical Methods
- OpenStax. Introductory Statistics 2e
Related Articles
- How to Calculate Cumulative Relative Frequency (Steps and Example)
- How to Calculate Standard Deviation: Formula and Steps
- How to Calculate the Correlation Coefficient (Step by Step)
- How to Make a Frequency Table in Excel (Step by Step)
- How to Calculate Correlation Coefficient in Excel (Step by Step)
- QC Frequency Calculators and Software