R vs Python: Differences and When to Use Each
By Dr. Zubair Khalid, DVM, MS, PhD ·
R vs Python is the most common fork in the road for anyone learning data analysis. Both are free, both are open source, and both can load a dataset, compute a mean, fit a regression, and plot the result. The differences show up in syntax, library ecosystems, and how each language treats statistics as a first-class citizen.
This article compares R and Python on the things that actually affect your daily work, then shows the same analysis run in both languages to prove the numbers match.
Quick Answer
- Choose R if your work is statistics, hypothesis testing, publication-quality graphics, or academic research in fields like biostatistics, ecology, and social science.
- Choose Python if your work mixes data analysis with production code, web services, automation, or deep learning at scale.
- Syntax differs most in data manipulation. R centers on vectors and formulas, Python centers on objects and method calls.
- The math is the same. The worked example below shows R and Python returning identical mean, standard deviation, regression coefficients, and $R^2$.
- You do not have to pick one forever. Many analysts prototype in R and deploy in Python, or use R for statistics and Python for engineering.
Key Differences
| Dimension | R | Python |
|---|---|---|
| Primary design goal | Statistical computing and graphics [1] | General-purpose programming |
| Core data structure | Vector, data frame, list | List, dict, NumPy array, DataFrame |
| Statistical modeling | Built-in, formula-based (lm(y ~ x)) | Library-based (statsmodels, scikit-learn) |
| Data manipulation | Base R, dplyr, data.table | pandas |
| Numerical foundation | Base R plus compiled packages | NumPy arrays [2] |
| Scientific computing | Specialized CRAN packages | SciPy [3] |
| Machine learning | caret, tidymodels, mlr3 | scikit-learn, PyTorch, TensorFlow |
| Graphics | Base graphics, ggplot2 | matplotlib, seaborn, plotly |
| Speed | Slower in pure loops, fast with vectorized code [4] | Faster general execution, fast with NumPy |
| Best fit | Research, statistics, reporting | Production, engineering, ML pipelines |
R Explained
R is a language and environment for statistical computing and graphics, built as an implementation of the S language developed at Bell Laboratories [1]. That lineage matters. R was designed by statisticians for statisticians, so statistical operations sit in the base language instead of a separate package.
The core strength is the formula interface. You write lm(score ~ hours) and R knows you mean a linear model with score as the response and hours as the predictor. The same formula syntax carries across dozens of modeling functions, which keeps your code short and readable.
R also has a wide variety of statistical and graphical techniques built in, including linear and nonlinear modeling, classical statistical tests, time-series analysis, classification, and clustering [1]. One of its stated strengths is the ease of producing publication-quality plots, including mathematical symbols and formulas [1].
The trade-off is performance. R is not a fast language in the general sense. It combines lazy function evaluation, extreme dynamism, and pass-by-value semantics, which are costly [4]. It also lacks base support for common computer science data structures, which limits how you pick efficient structures for specific tasks [4]. These are deliberate trade-offs that make sophisticated modeling easier for practitioners, but the cost grows as datasets get larger [4].
For a deeper look at how R reports model fit, see R and R-Squared: What They Mean and How to Interpret Them and Adjusted R-Squared vs R-Squared: Differences and Examples.
Python Explained
Python is a general-purpose language that grew into a data analysis platform through its scientific libraries. NumPy is the primary array programming library for Python and the foundation on which the rest of the scientific ecosystem is built [2]. It provides compact syntax for operating on vectors, matrices, and higher-dimensional arrays, and it plays an essential role in research pipelines across physics, chemistry, astronomy, biology, psychology, engineering, finance, and economics [2].
SciPy sits on top of NumPy as an open-source library for scientific computing. Since its first release in 2001 it has become a de facto standard for scientific algorithms in Python, with over 600 unique code contributors and millions of downloads per year [3].
For tabular data, pandas provides the DataFrame, a structure designed specifically for statistical computing in Python. If you are new to it, Pandas in Python: What It Is and How to Use DataFrames covers the basics, and Python Data Types: Definition, Examples and How to Check Them explains the type system underneath.
The statistical story is different from R. Python does not ship a formula-based modeling language in its standard library. You import statsmodels for classical statistics or scikit-learn for machine learning. That separation is the point. Python treats statistics as one library among many, which is why it dominates when analysis has to connect to a web app, a database, or a production service.
Worked Example
The dataset is a small survey of 20 respondents with hours studied and exam score.
| hours | score | hours | score | |
|---|---|---|---|---|
| 1 | 52 | 11 | 78 | |
| 2 | 55 | 12 | 80 | |
| 3 | 58 | 13 | 83 | |
| 4 | 61 | 14 | 85 | |
| 5 | 63 | 15 | 88 | |
| 6 | 66 | 16 | 90 | |
| 7 | 68 | 17 | 92 | |
| 8 | 71 | 18 | 94 | |
| 9 | 73 | 19 | 97 | |
| 10 | 76 | 20 | 99 |
The steps are the same in both languages: load the 20 rows, compute the mean and sample standard deviation of score, then fit an ordinary least squares regression of score on hours.
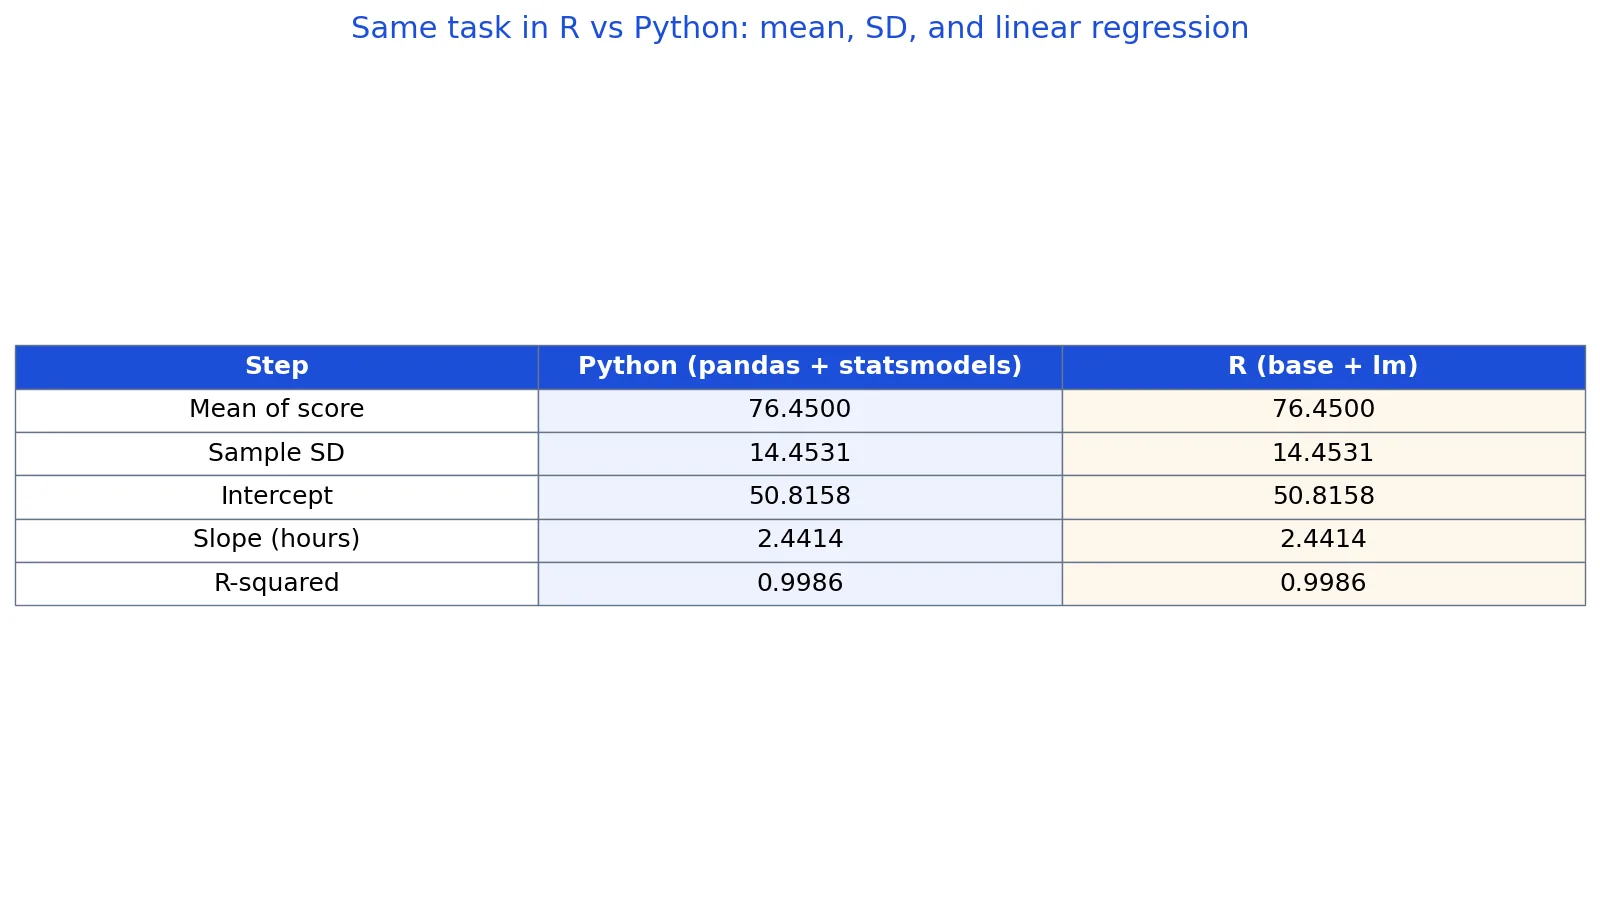
In Python, df['score'].mean() returns 76.4500 and df['score'].std(ddof=1) returns 14.4531. The statsmodels OLS fit gives score = 50.8158 + 2.4414*hours with $R^2 = 0.9986$.
In R, mean(score) returns 76.4500 and sd(score) returns 14.4531. The lm(score ~ hours) fit gives score = 50.8158 + 2.4414*hours with $R^2 = 0.9986$.
import pandas as pd, statsmodels.api as sm
df = pd.DataFrame({'hours': list(range(1, 21)),
                   'score': [52,55,58,61,63,66,68,71,73,76,78,80,83,85,88,90,92,94,97,99]})
print(df['score'].mean(), df['score'].std(ddof=1))
X = sm.add_constant(df['hours'])
m = sm.OLS(df['score'], X).fit()
print(m.params, m.rsquared)
hours <- c(1:20)
score <- c(52,55,58,61,63,66,68,71,73,76,78,80,83,85,88,90,92,94,97,99)
mean(score); sd(score)
m <- lm(score ~ hours)
summary(m)Output from both:
Python: mean=76.4500, sd=14.4531, score = 50.8158 + 2.4414*hours, R^2=0.9986
R:      mean=76.4500, sd=14.4531, score = 50.8158 + 2.4414*hours, R^2=0.9986
The slope of 2.4414 means each additional hour of study is associated with about 2.44 more points. The $R^2$ of 0.9986 means the linear fit explains almost all the variation in scores. The formula for the slope is:
$$\hat{\beta}_1 = \frac{\sum_{i=1}^{n}(x_i - \bar{x})(y_i - \bar{y})}{\sum_{i=1}^{n}(x_i - \bar{x})^2}$$
Both languages implement that same estimator. The choice between them is about workflow, not arithmetic.
Which One Should You Use?
Use R when the analysis is the deliverable. If you are writing a paper, running clinical trial statistics, building a meta-analysis, or producing figures for publication, R's formula interface and graphics defaults save time. The ecosystem is built around statistical methodology, and the S lineage means research methods often appear in R packages first [1]. If your field is life science, R vs. SPSS vs. Python for Biostatistical Analysis walks through the trade-offs in more detail.
Use Python when the analysis feeds something else. If your model has to run inside an application, a scheduled job, or a machine learning pipeline, Python's general-purpose nature removes friction. NumPy and SciPy give you the numerical base [3][2], pandas gives you the DataFrame [5], and scikit-learn gives you the modeling layer.
The distinction between statistics and machine learning matters here. Statistical modeling emphasizes inference, uncertainty, and interpretable parameters. Machine learning emphasizes prediction on held-out data [6]. R leans toward the first, Python leans toward the second, though both can do either.
If you are deciding for a specific field, Python vs. R for Biomedical Data Science and Python vs. R for Computational Biology cover domain-specific considerations.
Common Mistakes
- Assuming the languages give different answers. They do not. The worked example shows identical mean, SD, slope, and $R^2$. Differences you see usually come from defaults, not from the math. Fix: check the default arguments before blaming the language.
- Using the wrong standard deviation. NumPy's
np.std()defaults to the population formula withddof=0, while pandas.std()and R'ssd()use the sample formula with $n-1$. Fix: passddof=1to NumPy to match R. - Writing loops in R for row-by-row work. R is slow in pure loops because of its language design [4]. Fix: vectorize the operation or use a package built for the task.
- Treating Python's standard library as a statistics toolkit. It is not. Fix: import statsmodels or scipy.stats before you start modeling.
- Mixing up $R$ the language and $R^2$ the statistic. They share a letter and nothing else. Fix: read the context, and see R and R-Squared: What They Mean and How to Interpret Them if the notation trips you up.
- Learning both at once from scratch. You will confuse the syntax. Fix: get fluent in one, then map the concepts across.
Limitations
Neither language is a substitute for statistical understanding. Both will happily fit a regression to data that violates the assumptions, and both will report a high $R^2$ on a spurious relationship. The tool computes what you ask for.
R's performance limits become visible on large datasets because of its language design [4]. Python's flexibility means you can build a pipeline that is technically correct but statistically meaningless, since nothing in the language enforces modeling discipline. In both cases the constraint is your knowledge of the method, not the software.
Frequently Asked Questions
Is R or Python better for statistics?
R has a structural advantage because statistical modeling is built into the base language through the formula interface, and the ecosystem grew around statistical methodology [1]. Python matches R on results but requires importing libraries for the same tasks. For pure statistical inference and reporting, R is usually faster to work in.
Can I use R and Python together?
Yes. You can call Python from R and R from Python through interoperability packages, and you can run both in the same notebook environment. A common pattern is cleaning and modeling in R, then exporting results for a Python service, or the reverse.
Which is easier to learn for a beginner?
Python is generally easier as a first programming language because its syntax is regular and it is used across many domains. R is easier if your goal is specifically statistics, because the modeling syntax is short and the output is designed for statistical reading. Your target matters more than the language.
Do R and Python give the same regression results?
Yes, when you use the same estimator and the same data. The worked example above produced identical coefficients of 50.8158 and 2.4414 and an identical $R^2$ of 0.9986 in both languages. Any difference you observe comes from default settings, missing value handling, or a different estimator.
Should I learn both?
Learn one well first, then add the other when a project demands it. The concepts transfer. A linear model, a standard deviation, and a p-value mean the same thing in both languages, so the second language is mostly a syntax exercise once you know the statistics.
References
- R: What is R?
- Harris CR, Millman KJ, van der Walt SJ et al. (2020). Array programming with NumPy. Nature
- Virtanen P, Gommers R, Oliphant TE et al. (2020). SciPy 1.0: fundamental algorithms for scientific computing in Python. Nature Methods
- The R Journal: Collections in R: Review and Proposal
- McKinney W (2010). Data Structures for Statistical Computing in Python. Proceedings of the Python in Science Conference
- Bzdok D, Altman N, Krzywinski M (2018). Statistics versus machine learning. Nature Methods
Related Articles
- Adjusted R-Squared vs R-Squared: Differences and Examples
- R and R-Squared: What They Mean and How to Interpret Them
- CDF vs PDF: Differences and When to Use Each
- Pandas in Python: What It Is and How to Use DataFrames
- Data Table vs Graph: Differences and When to Use Each
- Python vs. R for Computational Biology
- Python vs. R for Biomedical Data Science
- R vs. SPSS vs. Python for Biostatistical Analysis