How to Collapse Data in R (Step by Step)
By Dr. Zubair Khalid, DVM, MS, PhD ·
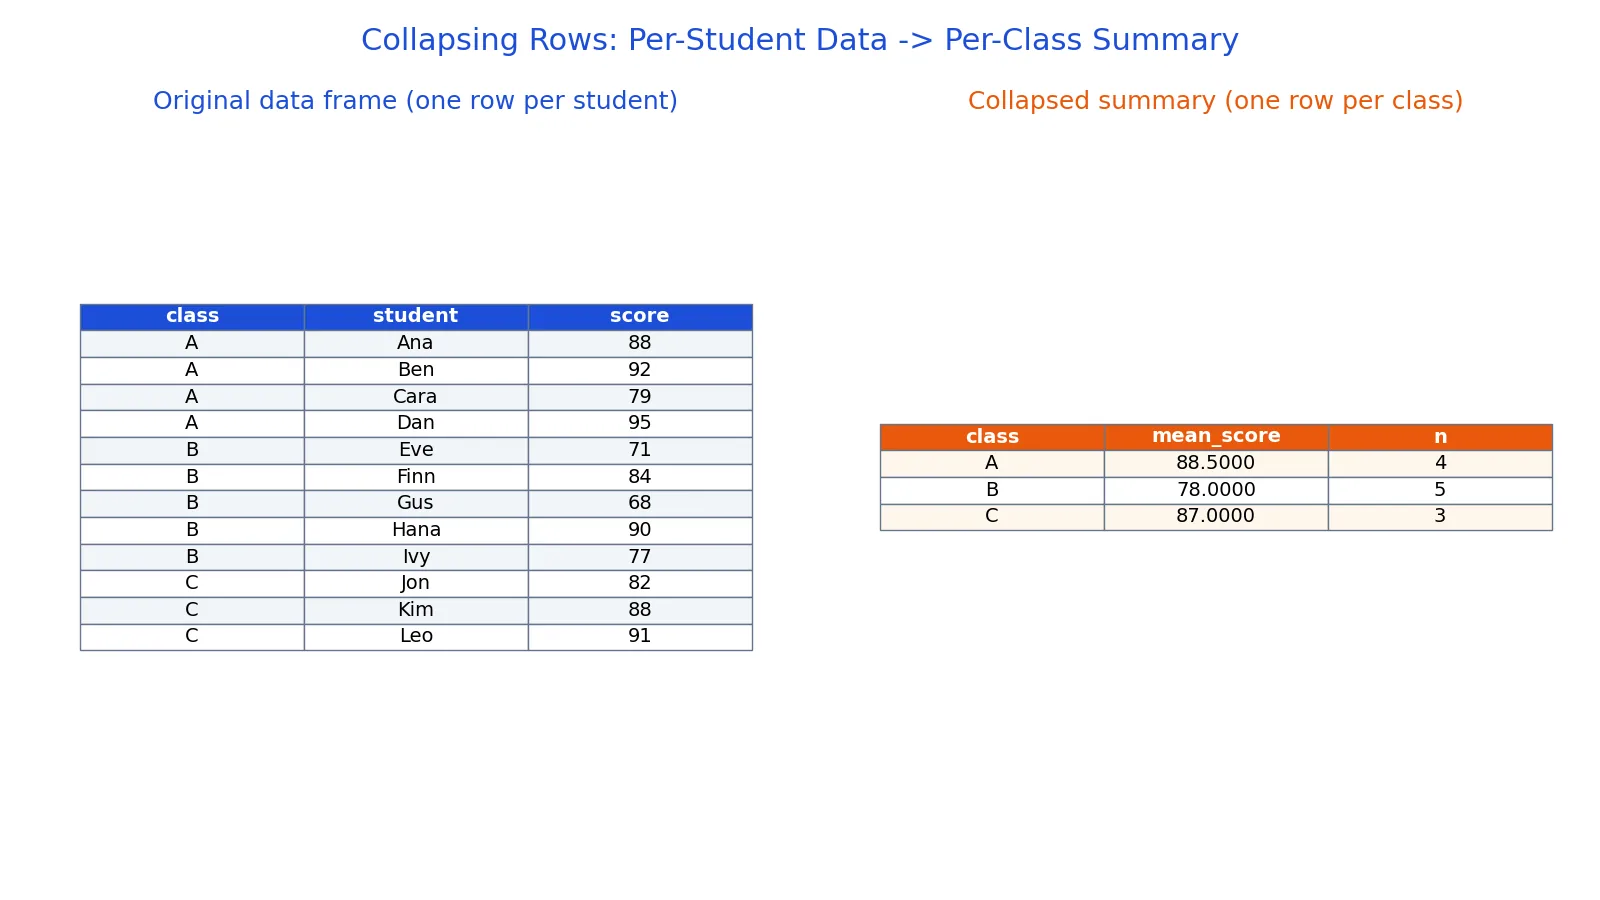
To collapse in R means to turn many rows into fewer rows by grouping on one or more columns and computing a summary for each group. You can do this with base R's aggregate() function or with group_by() and summarise() from dplyr. This article walks through both approaches on a small dataset so you can see exactly what changes.
Quick Answer
- Collapsing rows means grouping by a key column and replacing each group with one summary row.
- Base R:
aggregate(score ~ class, data = df, FUN = mean). - dplyr:
df %>% group_by(class) %>% summarise(mean_score = mean(score), n = n()). - The grouping column becomes the identifier of each collapsed row, and every other column must be summarized by a function.
- Both approaches give the same numbers. dplyr is easier to extend to many summary columns at once.
Before You Start
You need a data frame with at least one categorical column to group by and one numeric column to summarize. In this article the grouping column is class and the numeric column is score.
If your data is still in a CSV file, read it into R first with read.csv() or a similar function. The guide to reading CSV files in R covers the arguments you will need, including how to keep text columns as character instead of factor.
Two things to check before collapsing:
- The grouping column should contain repeated values. If every value is unique, each group has one row and collapsing does nothing useful.
- Missing values matter.
mean()returnsNAif any value in the group isNAunless you passna.rm = TRUE. Decide how you want to handle that before you run the summary.
The general shape of a collapse operation is:
$$ \text{grouped rows} \rightarrow \text{one row per group with } \sum, \bar{x}, n, \min, \max, \ldots $$
Step by Step
- Load or create your data frame. For the example below, the data frame has three columns:
class,student, andscore.
- Choose your grouping column. This is the column whose values define the groups. Here it is
class, with values A, B, and C.
- Choose your summary functions. The most common are
mean(),sum(),length()orn(),min(),max(), andmedian(). You can compute several at once.
- Run the collapse with base R. The formula interface reads as "score grouped by class":
aggregate(score ~ class, data = df, FUN = function(x) c(mean = mean(x), n = length(x)))- Or run the collapse with dplyr. Load the package, group the data, then summarize:
library(dplyr)
df %>% group_by(class) %>% summarise(mean_score = mean(score), n = n())- Check the row count. The result should have one row per unique value of the grouping column. If you grouped by two columns, it should have one row per unique combination.
- Rename and reorder if needed. In dplyr, the name you give inside
summarise()becomes the column name. In base R, the output column names come from the function's return value.
Worked Example
The dataset holds exam scores for 12 students spread across 3 classes. Here is the raw data frame.
| class | student | score |
|---|---|---|
| A | Ana | 88 |
| A | Ben | 92 |
| A | Cara | 79 |
| A | Dan | 95 |
| B | Eve | 71 |
| B | Finn | 84 |
| B | Gus | 68 |
| B | Hana | 90 |
| B | Ivy | 77 |
| C | Jon | 82 |
| C | Kim | 88 |
| C | Leo | 91 |
You want one row per class with the mean score and the number of students. The arithmetic for each group is:
- Class A: mean = (88 + 92 + 79 + 95) / 4 = 354 / 4 = 88.5000
- Class B: mean = (71 + 84 + 68 + 90 + 77) / 5 = 390 / 5 = 78.0000
- Class C: mean = (82 + 88 + 91) / 3 = 261 / 3 = 87.0000
The counts are 4, 5, and 3 students, which add up to the original 12 rows. Here is the code for both approaches.
aggregate(score ~ class, data = df, FUN = function(x) c(mean = mean(x), n = length(x)))

library(dplyr)
df %>% group_by(class) %>% summarise(mean_score = mean(score), n = n())
The output:
 # A tibble: 3 × 3
  class mean_score     n
  <chr>      <dbl> <int>
1 A           88.5     4
2 B           78       5
3 C           87       3
Twelve rows became three. Each collapsed row carries the group label, the group mean, and the group size. The student column is gone because it cannot be summarized by a number. If you need to keep a text column, you have to decide which value represents the group, for example the first student alphabetically.
Other Ways to Do It
The collapse package. Despite the name, the CRAN package collapse is a general-purpose data transformation library, not a function for collapsing rows. It provides fast grouped statistical functions written in C and C++, and it is designed to work alongside dplyr and data.table [1]. Its grouped functions skip missing values by default, which differs from base R [2]. If you are collapsing very large data frames and speed matters, it is worth a look [3].
data.table. The syntax dt[, .(mean_score = mean(score), n = .N), by = class] does the same job and is fast on large data.
tapply(). For a single numeric column, tapply(df$score, df$class, mean) returns a named vector of group means. It is quick for exploration but does not give you a data frame.
rowsum(). Useful when you only need group sums, for example rowsum(df$score, df$class).
For most analysis work, base R and dplyr cover the job. Reach for the others when your data is large enough that speed becomes the bottleneck.
Troubleshooting
The result has NA in the summary column. At least one group contains a missing value and your function does not remove it. Add na.rm = TRUE inside mean() or the other summary function.
The result has more rows than you expected. Your grouping column has more unique values than you thought, often because of trailing spaces or inconsistent capitalization. Check with unique(df$class).
summarise() drops a column you wanted. That is expected. Any column not in the grouping or the summary is discarded. Add it to group_by() or summarize it explicitly.
Base R returns a matrix-like column. When FUN returns a vector of length greater than one, aggregate() produces a column that is itself a matrix. Wrap the result in do.call(data.frame, ...) or use dplyr instead.
Group order looks wrong. Base R sorts groups alphabetically by default. dplyr also sorts by the grouping keys. If you need a specific order, reorder the result afterward.
Common Mistakes
- Forgetting
na.rm = TRUE. A single missing score turns the whole group mean intoNA. Fix it by passingna.rm = TRUEto the summary function. - Summarizing a text column with
mean(). This returnsNAwith a warning. Uselength(),n(), or a function that returns a value for text. - Grouping by a numeric ID that should be categorical. If
classwere stored as 1, 2, 3, grouping still works, but the labels in your output will be numbers. Convert to a factor or character first if you want readable labels. - Expecting the original row order to survive. Collapsed output is ordered by the grouping keys, not by the original rows.
- Using
summarise()withoutgroup_by(). You get a single row summarizing the entire data frame. That is sometimes what you want, but check it. - Losing the count. Always include
n()orlength()so you can see how many rows went into each summary. A mean of 88.5 from 4 students means something different from a mean of 88.5 from 400.
Limitations
Collapsing discards information. Once you replace 12 rows with 3, you cannot recover the individual scores from the summary unless you kept the original data frame. If you need both views, keep the raw data and store the collapsed version separately.
Summary functions also hide distribution shape. Two classes can share the same mean while one is tightly clustered and the other is split between very high and very low scores. A mean alone will not tell you that. Add min(), max(), or a standard deviation when the spread matters, and be careful about comparing group means when group sizes differ as much as 4, 5, and 3.
Frequently Asked Questions
What does it mean to collapse rows in R?
It means reducing a data frame so that each group of rows becomes a single row. You pick a grouping column, apply a summary function to the other columns, and the result has one row per group. The number of rows drops from the number of observations to the number of groups.
What is the difference between aggregate() and group_by() plus summarise()?
Both produce the same collapsed result. aggregate() is built into base R and needs no packages. group_by() and summarise() come from dplyr and are easier to chain with other operations, especially when you want several summary columns or further filtering after the collapse.
Can I collapse by more than one column?
Yes. In base R, write aggregate(score ~ class + term, data = df, FUN = mean). In dplyr, pass both columns to group_by(): group_by(class, term). The result has one row per unique combination of the grouping columns.
How do I keep a text column when collapsing?
You cannot average text, so you must choose a rule. Common choices are the first value, the last value, or the most frequent value. In dplyr you can use summarise(first_student = first(student)) or a similar helper. Decide the rule before you run it, because the choice changes the output.
Why did my collapsed data frame lose rows I expected to see?
The most likely cause is that some groups had only missing values in the summary column, so their summary came back as NA and you filtered them out later. Check the group counts first. If a group has a count of zero, it never existed in the data, and collapsing cannot create it.
References
Further Reading
- collapse Documentation and Resources
- collapse for tidyverse Users
- Wickham H (2014). Tidy Data. Journal of Statistical Software
- Wickham H, Averick M, Bryan J et al. (2019). Welcome to the Tidyverse. Journal of Open Source Software