Free Public Datasets: Where to Find Them and How to Use Them
By Dr. Zubair Khalid, DVM, MS, PhD ·
Public datasets are free, openly available collections of data that anyone can download and analyze. You find them in government portals, research repositories and open data catalogs, then load them into a tool like Python or Excel. This guide shows where the good ones live and walks through a full analysis of a small temperature file so you can repeat the process on your own data.
Quick Answer
- Public datasets are free to access, and most carry an open license that lets you reuse them with attribution.
- The best starting points are government open data portals, research repositories and domain-specific archives.
- Good datasets are documented, versioned and machine-readable, which follows the FAIR principles for reusable data [1].
- You usually download a CSV, JSON or Excel file, then load it with a few lines of code or a spreadsheet import.
- Always check the license, the units and the missing-value conventions before you compute anything.
What Public Datasets Mean
A public dataset is any structured collection of records that is released for anyone to access, usually at no cost, often under a license that permits reuse. The word "public" describes access, not quality. A file can be public and still be messy, undocumented or full of gaps.
The precise definition comes from open data practice. A dataset is reusable when it is findable, accessible, interoperable and reusable, the four FAIR principles [1]. Findable means it has a persistent identifier and rich metadata. Accessible means you can retrieve it with a standard protocol. Interoperable means it uses common formats and vocabularies. Reusable means it has a clear license and provenance. When a portal meets these criteria, you spend your time analyzing instead of hunting for column definitions.
How It Works
The mechanism is simple. A provider stores records in a table, exposes them through a download link or an API, and documents the schema. You retrieve the file, parse it into rows and columns, and compute summary statistics.
Most tabular data follows the relational model, where each row is an observation and each column is an attribute [2]. That structure is what lets a single function read a file and hand you a data frame.
For any numeric column, the two statistics you compute first are the mean and the sample standard deviation.
$$\bar{x} = \frac{1}{n}\sum_{i=1}^{n} x_i$$
Here $\bar{x}$ is the sample mean, $n$ is the number of observations, and $x_i$ is the value of the $i$-th observation. The sum runs over every row.
$$s = \sqrt{\frac{1}{n-1}\sum_{i=1}^{n}(x_i - \bar{x})^2}$$
Here $s$ is the sample standard deviation, and $n-1$ is the degrees of freedom. Dividing by $n-1$ instead of $n$ corrects the bias you get when you estimate the spread of a population from a sample. The range is simply the maximum minus the minimum.
Worked Example
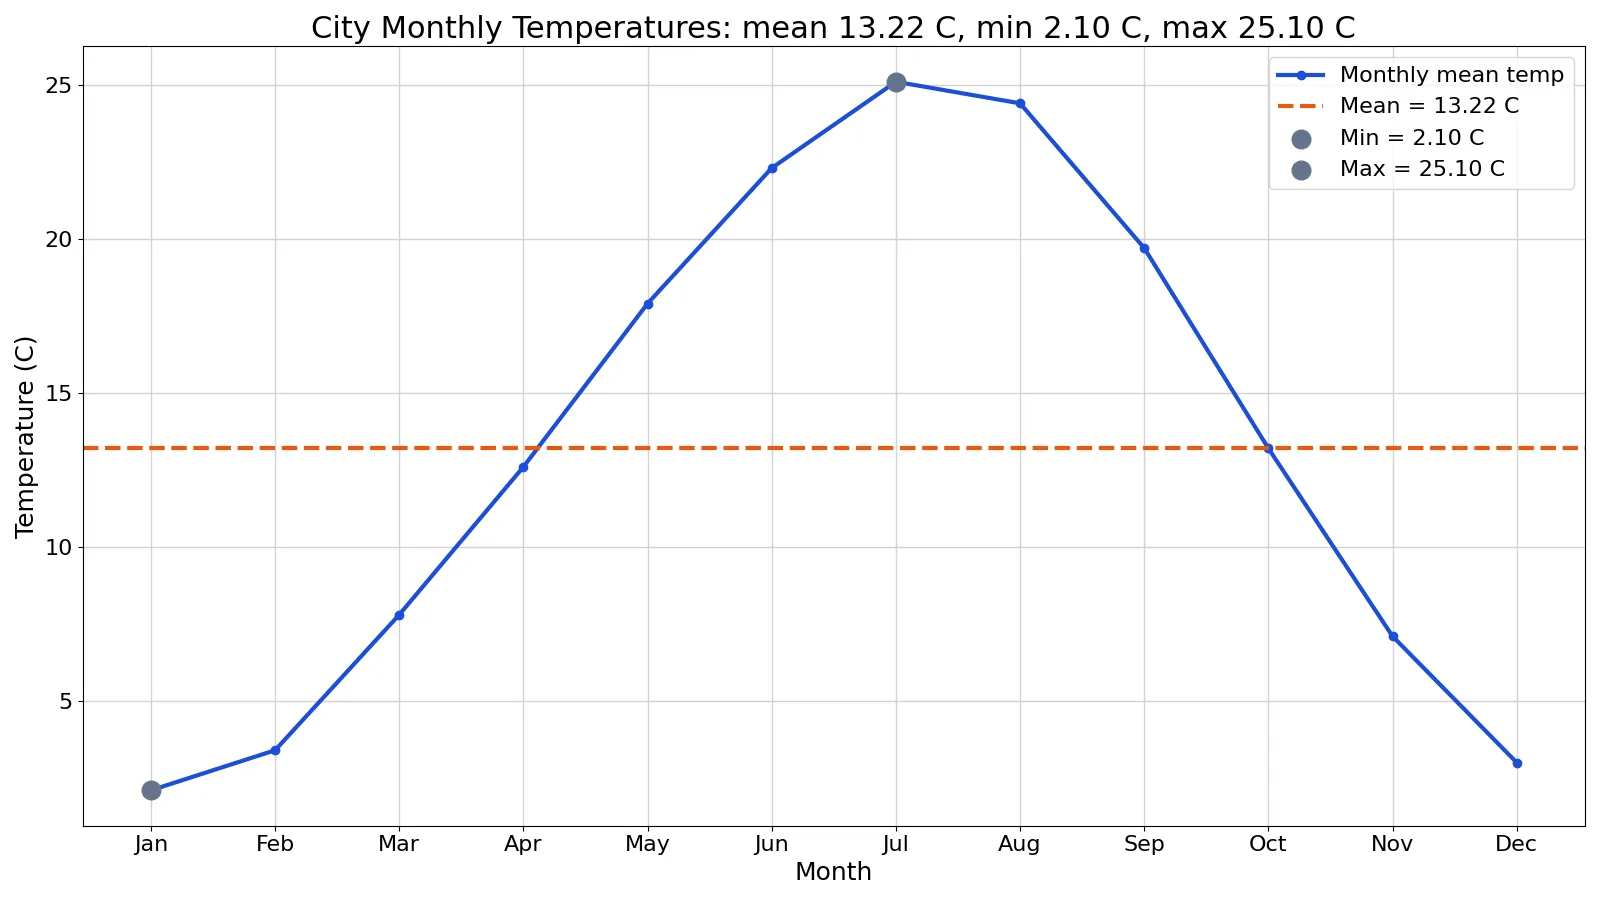
The dataset is a small file of monthly mean temperatures in degrees Celsius for one city, with 12 rows.
| month | temp_c |
|---|---|
| Jan | 2.1 |
| Feb | 3.4 |
| Mar | 7.8 |
| Apr | 12.6 |
| May | 17.9 |
| Jun | 22.3 |
| Jul | 25.1 |
| Aug | 24.4 |
| Sep | 19.7 |
| Oct | 13.2 |
| Nov | 7.1 |
| Dec | 3.0 |
The steps below use the values computed from this file.
| Step | Value |
|---|---|
| n (count of months) | 12 |
| Sum of temps | 158.6000 |
| Mean = sum / n | 158.6000 / 12 = 13.2167 |
| Min temp | 2.1000 (in Jan) |
| Max temp | 25.1000 (in Jul) |
| Range = max - min | 25.1000 - 2.1000 = 23.0000 |
| STDEV.S (n-1) | sqrt(804.2167/11) = 8.5505 |
The same numbers come out of a spreadsheet. If the temperatures sit in cells B2 through B13, then AVERAGE(B2:B13) returns 13.2167, MIN(B2:B13) returns 2.1000, MAX(B2:B13) returns 25.1000 and STDEV.S(B2:B13) returns 8.5505. The population version, STDEV.P, returns 8.1865 because it divides by 12 instead of 11.
In Python the whole thing is three lines.
import pandas as pd
df = pd.read_csv('city_temps.csv')
print(df['temp_c'].mean(), df['temp_c'].min(), df['temp_c'].max())
Output:
13.216666666666667 2.1 25.1The mean of 13.22 C sits between the coldest month and the warmest month, which is what you expect for a full annual cycle. The standard deviation of 8.55 C tells you that a typical month deviates from the annual mean by about 8.5 degrees. The range of 23.00 C is the full swing from January to July.
How to Interpret It
Read the mean first as a center of gravity, not as a typical value. In this file the mean is 13.22 C. October at 13.2 happens to sit almost exactly on it, but most months are far from it. A mean can fall in a gap between clusters.
Read the standard deviation as a scale. A value of 8.55 C sets a one standard deviation band around the mean of about 4.7 C to 21.8 C, and only 6 of the 12 months fall inside it. That is a wide spread for a single city, which reflects a strong seasonal cycle.
Read the minimum and maximum as the observed extremes, not the possible extremes. January at 2.10 C is the coldest month in this file, but it is not the coldest month the city has ever had. A 12-row file cannot tell you about record lows.
Always pair a number with its unit and its denominator. "13.22" alone is meaningless. "13.22 C, averaged over 12 months" is a finding.
When to Use It (and when not to)
Use public datasets when you need real variation, when you want to reproduce someone else's result, or when collecting your own data would be too slow or too expensive. They are ideal for learning a tool, testing a pipeline, benchmarking a model or teaching a concept. If you are practicing a new library, a small clean file like the one above is enough to get moving, and you can scale up to a larger sample dataset for practice once the basics work.
Do not use a public dataset when the population you care about is not the population it sampled. A national survey does not describe your local clinic. Do not use one when the license forbids your use, when the collection method is undocumented, or when the data is old enough that the pattern has changed. And do not treat a public file as ground truth. It is one measurement of the world, made by someone with their own constraints.
Public Datasets vs Private Datasets
The closest related idea is a private dataset, which is collected or licensed for a restricted audience.
| Feature | Public datasets | Private datasets |
|---|---|---|
| Access | Open to anyone | Restricted to authorized users |
| Cost | Usually free | Often paid or internal |
| License | Open, with attribution | Contractual, often no redistribution |
| Documentation | Varies, often published | Varies, often internal only |
| Reproducibility | High, others can rerun | Low, others cannot access |
| Typical use | Learning, benchmarking, research | Business operations, sensitive records |
The trade-off is control against reach. Private data can be tailored to your exact question, but nobody can check your work. Public data lets anyone reproduce your result, but you accept the schema and the sampling decisions someone else made.
Common Mistakes
- Ignoring the license. A file being downloadable does not mean you can republish it. Check the license field and credit the source.
- Skipping the data dictionary. Column names like
valorcode_3are meaningless without documentation. Read the schema before you compute. - Treating blanks as zeros. A missing temperature is not 0 C. Decide whether to drop, impute or flag missing values, and say which you did.
- Mixing units. One column in Celsius and another in Fahrenheit will wreck any average. Convert everything to one unit first.
- Using
STDEV.Pon a sample. If your rows are a sample of a larger population, use the n-1 version. The two differ here by 0.36 C. - Assuming the file is current. Portals update on their own schedule. Record the download date and the version so your result is reproducible.
Limitations
A public dataset cannot answer questions it was not designed to answer. The temperature file has 12 rows, one per month. It cannot tell you about daily variation, about a specific year, or about any city other than the one sampled. Aggregation hides detail, and a monthly mean erases every cold night and heat wave inside that month.
Public data also carries the biases of its collection. Sampling frames exclude people, instruments drift, and definitions change between releases. Two versions of the same dataset may not be comparable. When the stakes are high, treat any public file as a starting point that needs validation against a second source, not as a finished measurement.
Frequently Asked Questions
Where can I find free public datasets?
Start with government open data portals, which publish census, transport, health and climate files. Research repositories host scientific data with citations. Domain archives cover specific fields, such as genomic data repositories for biology. Aggregator sites collect links across many portals, which is handy for browsing but always verify the original source.
Are public datasets really free to use?
Most are free to access, and many carry open licenses that permit commercial and academic reuse with attribution. Some are free to view but restrict redistribution. Read the license before you publish anything derived from the data. When in doubt, contact the provider.
What file format should I download?
CSV is the safest default because every tool reads it and it is plain text. JSON works well for nested records. Excel files are convenient but can hide formulas and multiple sheets. For large files, look for Parquet or a database dump. If a portal offers an API, use it when you need to refresh the data regularly.
How do I load a public dataset in Python?
Download the file, then read it with pandas. For a CSV, pd.read_csv returns a data frame you can summarize immediately. For Excel, use pd.read_excel. For JSON, use pd.read_json. Check the first few rows and the data types before you compute anything, because a numeric column read as text will break your statistics.
How many rows do I need before the mean is meaningful?
There is no fixed number, but small samples give unstable estimates. With 12 monthly values, the mean is a reasonable summary of the annual cycle, yet the standard deviation has only 11 degrees of freedom and will move noticeably if you add or drop a month. For a formal estimate of uncertainty on a small sample, use methods designed for small n [3]. For exploratory work, plot the values before you trust any single number.
If you work with biological data, the same retrieval and licensing logic applies to public RNA-seq datasets and to single-cell data from GEO and SRA. The mechanics of finding, downloading and documenting a file are the same across fields, and getting them right is what makes your analysis reproducible.
References
- Wilkinson MD, Dumontier M, Aalbersberg IJ et al. (2016). The FAIR Guiding Principles for scientific data management and stewardship. Scientific Data
- Codd EF (1970). A relational model of data for large shared data banks. Communications of the ACM
- Bland JM, Altman DG (2009). Analysis of continuous data from small samples. BMJ
Further Reading
- 1.4.3. References For Chapter 1: Exploratory Data Analysis
- 2.5.3.2.1. Data collection and analysis
- 2.2.3.2. Data collection
- Bzdok D, Altman N, Krzywinski M (2018). Statistics versus machine learning. Nature Methods