What Are Synthetic Datasets? Definition and Examples
By Dr. Zubair Khalid, DVM, MS, PhD ·
Synthetic datasets are artificial records created to mimic the statistical patterns of real data without containing any actual person's information. Analysts use them to share, test, and train on data when the original records are private, expensive, or too small. They are generated by fitting a model to real data and then sampling new values from that model.
Quick Answer
- A synthetic dataset is generated data, not collected data. The values are simulated from a model estimated on real records [1].
- The main reason to build one is privacy. Releasing simulated values makes it hard to re-identify individuals and their sensitive attributes [1].
- The second reason is access. Real clinical data is often restricted by privacy obligations, which blocks research and model development [2].
- Utility is measured by replicability, meaning whether analyses on the synthetic data reproduce the results from the real data [3].
- Quality depends on the generator. A model trained on synthetic data can rival one trained on real data when the synthetic data is realistic enough [4].
What Synthetic Datasets Mean
In plain terms, a synthetic dataset is a stand-in. It looks like your real data in shape and distribution, but every row is fabricated. No row corresponds to a real respondent, patient, or customer.
The precise statistical definition is narrower. A synthetic dataset is a set of records whose values are drawn from a probability model $\hat{P}$ that was estimated from a confidential or original dataset $D$. The generator learns the joint distribution of the variables, then produces new records $x^* \sim \hat{P}$. Because the values are simulated, re-identification is difficult, and the released file can often be treated as a public use file [1].
This is different from a masked or redacted dataset, where real rows stay in place and only some fields are altered. In a fully synthetic file, the rows themselves are new.
How It Works
The mechanism has three stages: fit, sample, release.
Stage 1: Fit a model to the real data. You estimate the distribution of the original records. For a single numeric variable, the simplest model is a normal distribution with the sample mean and sample standard deviation.
$$\hat{\mu} = \frac{1}{n}\sum_{i=1}^{n} x_i \qquad \hat{\sigma} = \sqrt{\frac{\sum_{i=1}^{n}(x_i - \hat{\mu})^2}{n-1}}$$
- $x_i$ is the $i$-th real value.
- $n$ is the number of real records.
- $\hat{\mu}$ is the estimated mean, the center of the distribution.
- $\hat{\sigma}$ is the estimated standard deviation, the spread. The $n-1$ denominator is the sample version, which makes the variance estimate unbiased.
Stage 2: Sample new values. You draw $m$ new values from the fitted model:
$$x^*_j \sim \mathcal{N}(\hat{\mu}, \hat{\sigma}^2), \quad j = 1, \dots, m$$
- $m$ is the number of synthetic records you want, and it can be much larger than $n$.
- $\mathcal{N}(\hat{\mu}, \hat{\sigma}^2)$ is a normal distribution with that mean and variance.
Stage 3: Release and evaluate. You check that the synthetic data reproduces the analyses you care about. Replicability has two criteria: replicate the results of the analyses on real data, and support valid population inferences from the synthetic data [3].
Real generators are more elaborate than a single normal curve. They include generative machine-learning models that produce realistic images for training downstream vision tasks [4], masked modeling frameworks for survival data [2], and flow-based methods that perturb points in a latent space and map them back to the data domain [5]. The logic is the same at every level of complexity: learn the distribution, then draw from it.
Worked Example
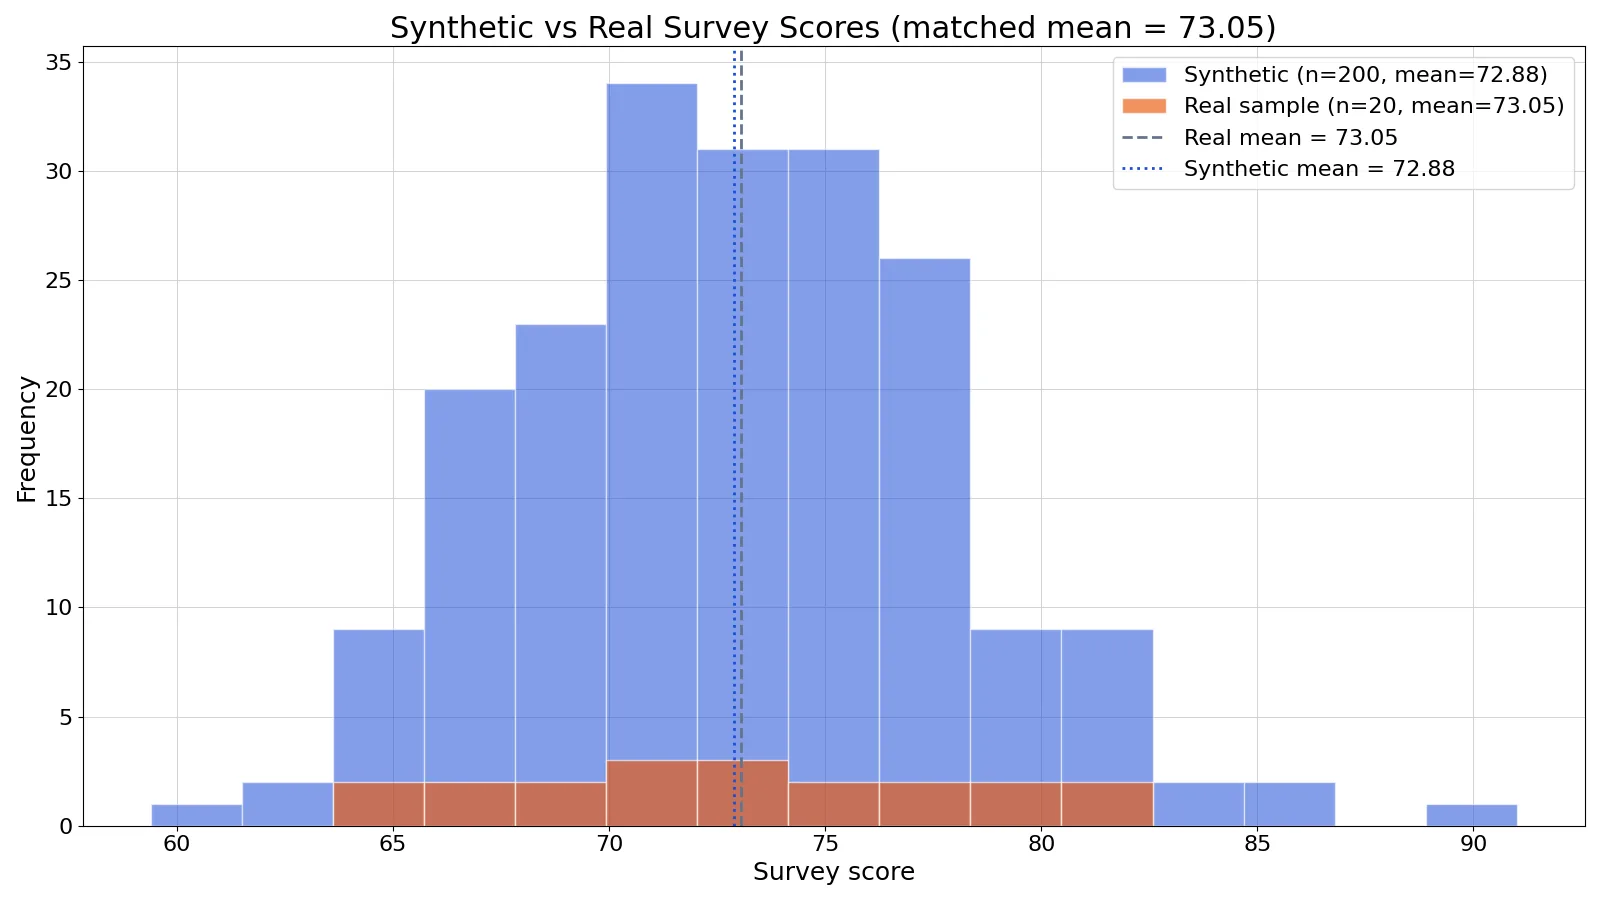
Take a small survey of 20 respondents who each gave a satisfaction score. You want 200 synthetic scores that behave like the real ones, so you fit a normal distribution to the real sample and sample from it.
The real scores:
| # | 1 | 2 | 3 | 4 | 5 | 6 | 7 | 8 | 9 | 10 |
|---|---|---|---|---|---|---|---|---|---|---|
| Score | 72 | 65 | 80 | 74 | 68 | 77 | 71 | 69 | 82 | 75 |
| # | 11 | 12 | 13 | 14 | 15 | 16 | 17 | 18 | 19 | 20 |
|---|---|---|---|---|---|---|---|---|---|---|
| Score | 66 | 79 | 73 | 70 | 76 | 64 | 81 | 78 | 67 | 74 |
Step by step:
- Real sample size: $n = 20$.
- Real sample mean: $\sum x / n = 1461 / 20 = 73.0500$.
- Real sample SD with the $n-1$ denominator: $\sqrt{\sum (x - \bar{x})^2 / (n-1)} = 5.4818$.
- Generate 200 synthetic values from a normal distribution with mean 73.0500 and SD 5.4818.
- Synthetic mean: 72.8831.
- Synthetic SD: 4.8346.
In Excel, the same two statistics come from =AVERAGE(A2:A21) giving 73.0500 and =STDEV.S(A2:A21) giving 5.4818.
import numpy as np
real = [72, 65, 80, 74, 68, 77, 71, 69, 82, 75,
        66, 79, 73, 70, 76, 64, 81, 78, 67, 74]
mean_real = np.mean(real)
sd_real = np.std(real, ddof=1)
rng = np.random.default_rng(42)
synth = rng.normal(loc=mean_real, scale=sd_real, size=200)
print(f"mean_real={mean_real:.4f}, sd_real={sd_real:.4f}, mean_synth={synth.mean():.4f}, sd_synth={synth.std(ddof=1):.4f}")
Output:
mean_real=73.0500, sd_real=5.4818, mean_synth=72.8831, sd_synth=4.8346The synthetic mean lands 0.17 points below the real mean and the synthetic SD is about 0.65 points narrower. That gap is sampling noise, not a flaw in the method. Draw again with a different seed and the numbers move.
How to Interpret It
Read a synthetic dataset as a distribution, not as a set of facts. The mean, spread, and correlations are the content. Individual rows carry no information about any real person.
Compare the summary statistics side by side. In the example, the real mean is 73.05 and the synthetic mean is 72.88, so the center is preserved. The real SD is 5.48 and the synthetic SD is 4.83, so the spread is slightly understated. That is the kind of check you run first.
Then check the analyses you actually care about. For a regression, that means comparing coefficients, standard errors, and confidence intervals between the real and synthetic fits. Eight metrics are commonly used for this: decision agreement, estimate agreement, standardized difference, confidence interval overlap, bias, confidence interval coverage, statistical power, and precision [3]. A synthetic file that matches means but flips the sign of a key coefficient has failed.
When to Use It (and when not to)
Use synthetic data when the real data cannot be shared. Health records are the classic case, since access is restricted by privacy obligations and synthetic versions enable secure data sharing and model development [2]. A synthetic version of a curated health dataset can be released for research and training while the original stays behind a terms-of-use agreement [6].
Use it to enlarge or rebalance a small sample. Synthetic versions that mimic the statistical distributions of the original data can provide a larger set or balance sets that underrepresent certain groups [6].
Use it to test pipelines before real data arrives. You can build a full analysis workflow against a synthetic file and swap in the real data later.
Do not use it as evidence about the real world. A synthetic dataset contains no new information. If your model learns a pattern that was not in the original data, that pattern is an artifact of the generator.
Do not use it when the generator is weak and the decision is high stakes. If the synthetic data cannot replicate the real analysis, it cannot support the same conclusions.
Synthetic Datasets vs Augmented Data
These two terms get mixed up. Augmentation keeps the real records and adds generated ones. Synthesis replaces them.
| Property | Synthetic data | Augmented data |
|---|---|---|
| Real rows included | No | Yes |
| Purpose | Privacy, sharing, public release | More training examples, class balance |
| Privacy risk | Lower, since values are simulated [1] | Higher, since real rows remain |
| Typical use | Public use files, restricted health data [2] | Image and text model training [4] |
| Size | Can be much larger than the source | Source size plus added rows |
Some frameworks do both. Masked Clinical Modelling is designed for data synthesis and conditional data augmentation in the same system [2].
Common Mistakes
- Treating synthetic rows as real observations. A synthetic row is a draw from a model, not a measurement. Fix: report synthetic results as simulation results and never merge them with real records without labeling the source.
- Checking only the mean. Matching the center says nothing about spread, skew, or relationships. Fix: compare SD, quantiles, and the correlations or regression coefficients you plan to use.
- Generating once and shipping it. A single draw can look good by luck. Fix: generate multiple synthetic datasets and combine the fitted models using combining rules for fully synthetic datasets, as in a multiple imputation approach with up to 20 datasets [3].
- Assuming privacy is automatic. Simulated values reduce disclosure risk but do not eliminate it. Fix: assess disclosure risk for data subjects before release, which is an open methodological topic [1].
- Ignoring rare categories. A normal model rarely produces values far in the tail, and it cannot reproduce heavy tails, skew or rare categories. Fix: check the minimum and maximum of the synthetic data against the real range, and use a generator that handles the tails.
- Skipping the utility report. Reviewers and data stewards need evidence. Fix: publish the replicability metrics alongside the file.
Limitations
A synthetic dataset cannot contain information that was not in the source data. If the real sample of 20 scores missed the highest and lowest performers, the synthetic file will miss them too, and it will miss them more confidently because it has 200 rows. Overconfidence is the characteristic failure mode.
The generator also inherits the biases of the original data. Datasets often contain biases that hurt model performance, and generating from them does not remove those biases [4]. A synthetic file built from an unrepresentative sample is an unrepresentative sample with more rows.
Finally, utility and privacy pull against each other. A generator that copies the real data too closely produces useful synthetic records and weak privacy protection. One that smooths too much protects privacy and destroys the relationships you wanted to study. Tuning that trade-off is the hard part, and the methods for assessing disclosure risk and for helping analysts evaluate their synthetic data inferences are still developing [1].
Frequently Asked Questions
Are synthetic datasets real data?
No. Every value is generated by a model, not collected from a person or sensor. The statistical patterns can closely match real data, and a model trained on synthetic data can rival one trained on real data [4], but the individual records are fabricated.
Are synthetic datasets safe to share?
Safer than the original, not risk-free. Simulated values make re-identification difficult, which is why data stewards consider synthetic public use files [1]. You still need a disclosure risk assessment before release.
How many synthetic records should I generate?
Enough to stabilize the analysis, and often more than the original. In the worked example, 20 real scores became 200 synthetic scores. For regression work, a common pattern is to generate multiple datasets, up to 20, and combine the fitted models [3].
How do I know if a synthetic dataset is good enough?
Test whether it replicates the analyses you care about. Replicability means the results on synthetic data match the results on real data and support valid population inferences [3]. If your key coefficient, its confidence interval, and your decision all hold up, the file is usable for that purpose.
Can synthetic data replace the original dataset?
For training and pipeline testing, often yes. For publishing new scientific findings about the population, no. The synthetic file carries no information beyond what the generator learned from the original, so any claim about the world still rests on the real data.
References
- Enhancing Synthetic Data Techniques for Practical Applications | Duke Cybersecurity Hub
- Kuo NI, Gallego B, Jorm LR. (2025). Masked Clinical Modelling: A Framework for Synthetic and Augmented Survival Data Generation. Studies in health technology and informatics
- El Emam K, Mosquera L, Fang X, El-Hussuna A. (2024). An evaluation of the replicability of analyses using synthetic health data. Scientific reports
- When it comes to AI, can we ditch the datasets? - MIT Schwarzman College of Computing
- Statistical advances in synthetic data generation and longitudinal analysis | Stanford Digital Repository
- Georgetown Data Bridge - Synthetic Data Bridge
Related Articles
- Dataset Examples: Types of Data Sets With Real Samples
- What Is a Dataset? Definition, Types and Examples
- Quantitative Data Examples: Definition and Types
- What Is Discrete Data? Definition and Examples
- Sample Datasets for Practice: Where to Find and How to Use Them
- What Is Meant by Synthetic in Synthetic Biology