Sample Datasets for Practice: Where to Find and How to Use Them
By Dr. Zubair Khalid, DVM, MS, PhD ·
Sample datasets are ready-made collections of data that you can download and analyze without collecting anything yourself. They exist so you can practice a technique, test code, or teach a class when the research question matters less than the skill. This article explains what they are, where to find them, and how to load and inspect one.
Quick Answer
- A sample dataset is a small, complete, freely available data file built for learning or testing, not for answering a real research question [1].
- Good starting points include Kaggle Datasets, the UCI Machine Learning Repository, CORGIS, RDatasets, and Data.gov [2][3].
- Most come as CSV, JSON, or tab-delimited files, so any spreadsheet or statistics tool can open them [2].
- Load one with a few lines of code, then check its shape, column types, and missing values before you analyze anything.
- Practice on sample datasets when the goal is learning a method. Switch to real data when the substance of the question matters [1].
What Sample Datasets Mean
A sample dataset is a collection of observations packaged for practice. It usually ships with documentation, a known number of rows and columns, and a topic simple enough to explore in one sitting.
The precise definition is narrower. In statistics, a sample is a subset drawn from a larger population, and a dataset is the structured record of that subset's variables and values. A sample dataset is therefore a fixed, documented subset that stands in for a population you are not actually studying. The point is to give you realistic structure without the cost, privacy limits, or mess of primary data collection.
This is different from a live production dataset, which changes as new records arrive. A sample dataset is frozen. Everyone who downloads it sees the same rows, which is why instructors and documentation writers rely on them.
How It Works
The mechanism is simple. You download a file, load it into a tool, and inspect it. The inspection step follows a standard pattern, and the summary statistics you compute depend on the data type.
For a numeric column, the mean is the sum of values divided by the count of non-missing values:
$$\bar{x} = \frac{\sum_{i=1}^{n} x_i}{n}$$
Here $\bar{x}$ is the sample mean, $x_i$ is each individual value, and $n$ is the number of non-missing values in that column. The median is the middle value once the column is sorted, or the average of the two middle values when the count is even.
Missing values are handled separately. Most tools skip them in the mean and median by default, then report them with a count. That is why a column's mean can be based on fewer rows than the dataset has.
Worked Example
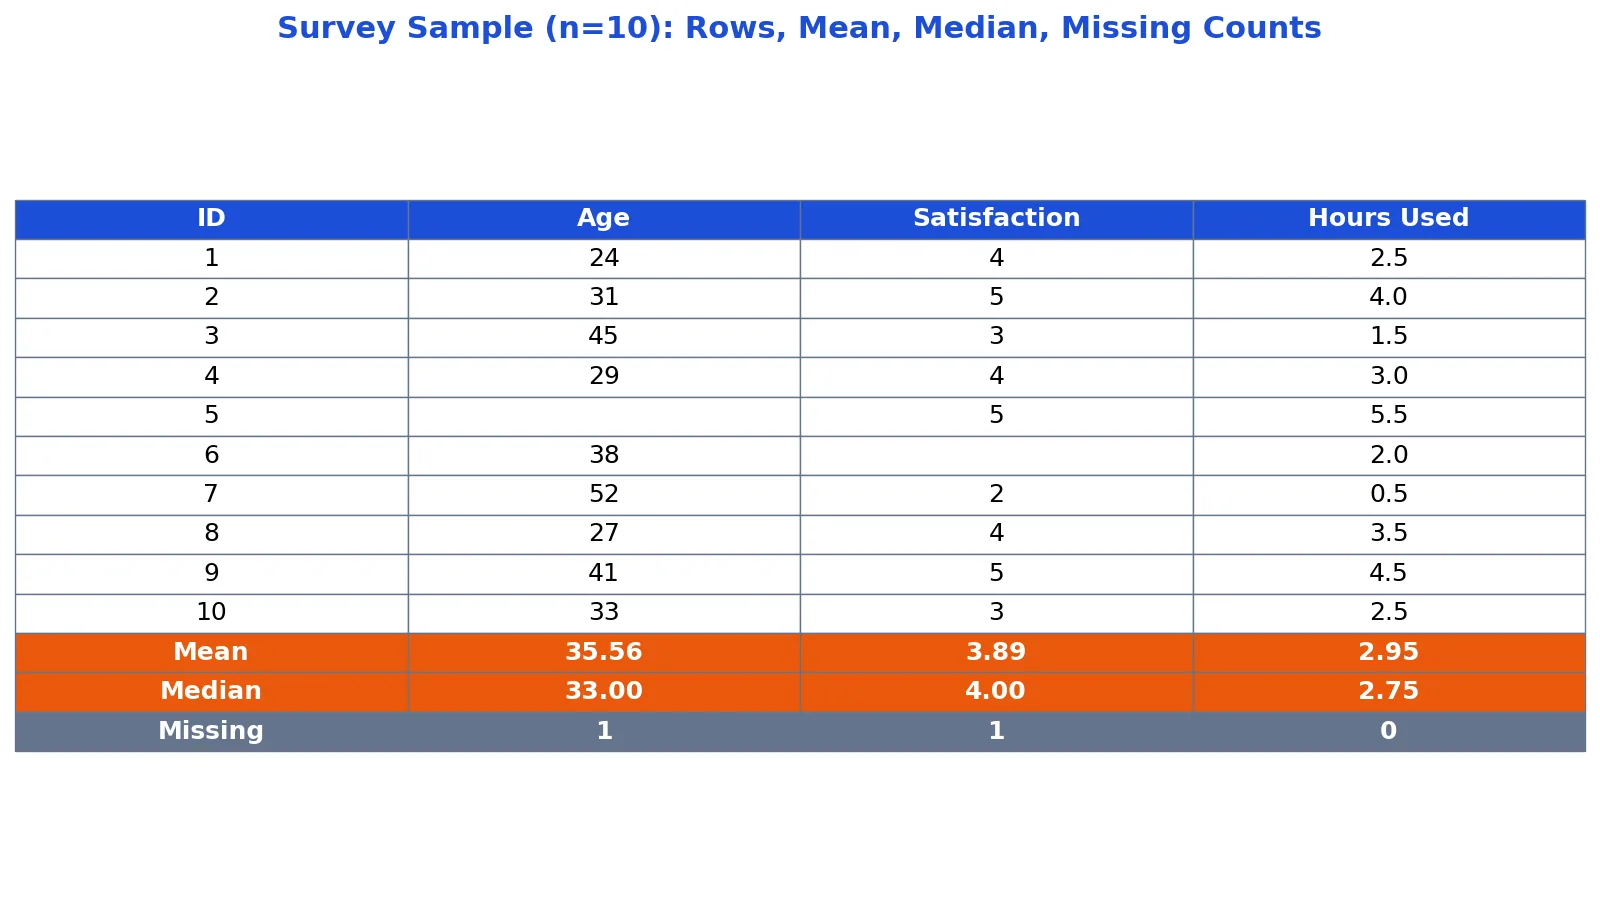
Take a small survey dataset with 10 responses. Each row is one respondent, with columns for respondent ID, age, satisfaction on a 1 to 5 scale, and hours used per week. Two values are missing.
| respondent_id | age | satisfaction | hours_used |
|---|---|---|---|
| 1 | 24 | 4 | 2.5 |
| 2 | 31 | 5 | 4.0 |
| 3 | 45 | 3 | 1.5 |
| 4 | 29 | 4 | 3.0 |
| 5 | (missing) | 5 | 5.5 |
| 6 | 38 | (missing) | 2.0 |
| 7 | 52 | 2 | 0.5 |
| 8 | 27 | 4 | 3.5 |
| 9 | 41 | 5 | 4.5 |
| 10 | 33 | 3 | 2.5 |
Load the data and compute the summary statistics.
import pandas as pd
df = pd.DataFrame({
    'age': [24, 31, 45, 29, None, 38, 52, 27, 41, 33],
    'satisfaction': [4, 5, 3, 4, 5, None, 2, 4, 5, 3],
    'hours_used': [2.5, 4.0, 1.5, 3.0, 5.5, 2.0, 0.5, 3.5, 4.5, 2.5],
})
print(df.mean(numeric_only=True))
print(df.median(numeric_only=True))
print(df.isnull().sum())
Output:
age mean=35.5556, median=33.0000; satisfaction mean=3.8889, median=4.0000; hours_used mean=2.9500, median=2.7500; missing: age=1, satisfaction=1, hours_used=0Walking through the steps:
- Load the dataset. The result is a pandas DataFrame with 10 rows and 4 columns.
- Age mean. The sum of the nine non-missing ages is 320.0, divided by 9 gives 35.5556.
- Age median. With nine non-missing ages, the median is the fifth sorted value, 33.0000.
- Satisfaction mean. The sum of the nine non-missing scores is 35.0, divided by 9 gives 3.8889.
- Satisfaction median. With nine non-missing scores, the median is the fifth sorted value, 4.0000.
- Hours mean. All ten values are present, so 29.5 divided by 10 gives 2.9500.
- Hours median. The middle two sorted values are 2.5 and 3.0, averaging to 2.7500.
- Missing values. Age has 1, satisfaction has 1, hours used has 0, for 2 total.
How to Interpret It
The gap between mean and median tells you about the shape of a column. Age has a mean of 35.5556 and a median of 33.0000, so the mean sits above the median and the distribution leans right. Satisfaction has a mean of 3.8889 and a median of 4.0000, so the two are close and the scores are fairly balanced. Hours used has a mean of 2.9500 and a median of 2.7500, again slightly right-leaning.
The missing-value counts matter just as much. Age and satisfaction each lose one row from their calculations, so their means rest on nine observations, not ten. Hours used uses all ten. If you reported a single "average" for the whole dataset without checking, you would mix columns with different denominators. For more on choosing between these two measures, see mean vs median differences.
When to Use It (and when not to)
Use a sample dataset when the technique is the point. Learning to join tables, fit a regression, or build a chart is easier when the data is clean and documented. Sample datasets are also the right choice for testing code before you point it at real files, and for teaching, since every student sees identical results [1].
Do not use one when the substance of the question matters. If you need to know something about a specific population, a practice file will not answer it. Reach for a real public dataset instead, such as those covered in our guide to free public datasets. Sample data is also a poor fit for anything involving sensitive or regulated information, since the file is public by design.
Sample Datasets vs Real Datasets
| Feature | Sample dataset | Real dataset |
|---|---|---|
| Purpose | Practice and teaching [1] | Answering a research question |
| Size | Small, fixed | Often large, sometimes growing |
| Documentation | Usually included | Varies widely |
| Cleanliness | Typically tidy | Often messy |
| Privacy risk | None, it is public | May contain sensitive records |
| Reproducibility | Identical for everyone | Depends on the snapshot |
The distinction is about intent, not format. Both can be CSV files with the same columns. What separates them is that a sample dataset was assembled so you could learn from it.
Common Mistakes
- Skipping the inspection step. Load the data and check shape, types, and missing counts before any analysis. A quick summary catches problems early.
- Ignoring missing values. A mean computed on nine rows is not the same as one computed on ten. Always report the denominator alongside the statistic.
- Assuming the file is clean. Sample datasets are tidier than most real data, but they still contain nulls, odd categories, and outliers. Treat them as data, not as a solved problem.
- Using a sample dataset to answer a real question. Practice files are not representative of any population. If the topic matters, find a real source [1].
- Forgetting to record the source. Note where the file came from and when you downloaded it, so your work stays reproducible.
- Mixing up column types. A numeric-looking ID column is still an identifier. Averaging it produces a meaningless number.
Limitations
Sample datasets cannot tell you anything about a real population. They are small, often deliberately simplified, and chosen because they are easy to work with, not because they represent anyone. A result you get from one is a result about that file.
They also age. A file frozen years ago may use outdated categories, retired column names, or formats your current tools handle differently. And because they are clean by design, they can give you a false sense of how much preparation real data needs. Use them to build skills, then expect more work when you move to live sources.
Frequently Asked Questions
What are sample datasets used for?
They are used to practice analysis techniques, test code, and teach statistics when the research question is secondary to learning the method [1]. Instructors favor them because every student works with identical data and gets identical results.
Where can I find free sample datasets?
Kaggle Datasets, the UCI Machine Learning Repository, CORGIS, RDatasets, DASL, and FiveThirtyEight all offer free practice data [2][1]. For government data, Data.gov hosts the U.S. federal open data catalog [3][4]. Google Dataset Search is useful when you want to search across many repositories at once [2].
What file formats do sample datasets come in?
CSV is the most common, followed by JSON and tab-delimited text [2]. CORGIS provides files in formats such as CSV and JSON, and DASL uses tab-delimited files [2]. Most statistics and spreadsheet tools open all three without extra setup.
How do I load a sample dataset?
Download the file, then load it with your tool of choice. In Python, pandas reads a CSV with a single function call, and R has equivalent readers. Once loaded, print the shape, the column types, and the missing-value counts before you compute anything else.
How many rows do I need to practice?
There is no fixed number. A file with a few dozen rows is enough to practice loading, cleaning, and summarizing. Larger files help when you want to test performance or work with grouped operations. Start small and move up as your skills grow. If you are planning a real study instead, see our guide to sample size notation.
References
- Sample Datasets - Analytics, Business Analytics, Data Science, and Statistics Library Resources - Research and Course Guides at University of St. Thom
- Datasets for Practice - Find Data & Statistics - InfoGuides at George Mason University
- Catalog - Data.gov
- Data.gov Home - Data.gov
Further Reading
- Public Use Datasets - Data Sets for Quantitative Research - Library Guides at University of Missouri Libraries
- GitHub - awesomedata/awesome-public-datasets: A topic-centric list of HQ open datasets. · GitHub
Related Articles
- Free Public Datasets: Where to Find Them and How to Use Them
- Dataset Examples: Types of Data Sets With Real Samples
- Sample vs Population Standard Deviation: When to Use Each
- CDF vs PDF: Differences and When to Use Each
- What Are Synthetic Datasets? Definition and Examples
- How to Choose a Data Repository for Your Life Science Dataset
- Statistical Tests: Choosing the Right One for Your Data
- How to Estimate Data Collection Time for Your Dissertation