R and R-Squared: What They Mean and How to Interpret Them
By Dr. Zubair Khalid, DVM, MS, PhD ·
R and r squared are two of the most quoted numbers in regression, and they are easy to confuse because one is the square of the other. The correlation coefficient r tells you the strength and direction of a straight-line relationship between two variables. The coefficient of determination, written R², tells you the share of variation in the outcome that your model accounts for.
Quick Answer
- r ranges from -1 to +1. Its sign shows direction, its distance from 0 shows strength.
- R² ranges from 0 to 1. It is r squared in simple linear regression with one predictor.
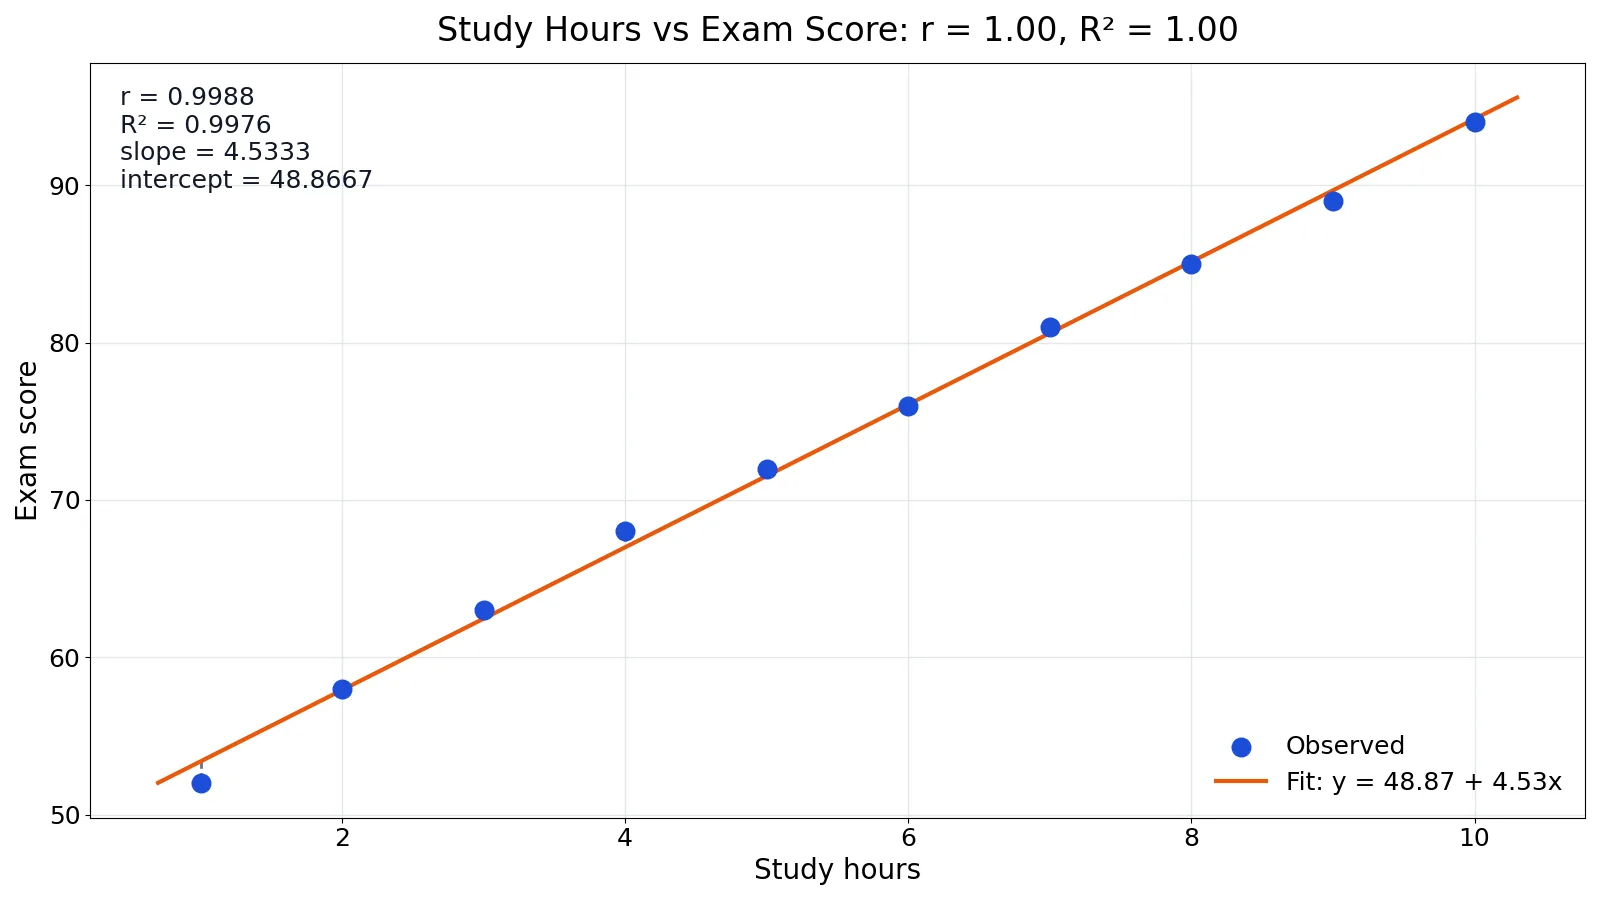
- r = 0.9988 means a near-perfect positive linear relationship. R² = 0.9976 means the model explains 99.76% of the variation in the outcome.
- r is symmetric. The correlation between hours and score equals the correlation between score and hours.
- R² is not symmetric in meaning. It describes how well a model predicts the outcome, so the roles of predictor and outcome matter.
What Is R Squared?
R squared is the share of the variation in an outcome variable that a regression model accounts for. It runs from 0 to 1, and in simple linear regression with one predictor it is exactly the square of the correlation coefficient r. So r tells you how tightly two variables follow a straight line and in which direction, while R squared tells you what fraction of the outcome's ups and downs the model explains.
The correlation coefficient r ranges from -1 to +1. Its sign gives direction and its distance from 0 gives strength. R squared ranges from 0 to 1 and has no sign, because squaring removes it. An r of -0.80 and an r of +0.80 both produce an R squared of 0.64.
| Question you are asking | Statistic to report |
|---|---|
| Do these two variables move together, and in which direction? | r |
| How much of the outcome's variation does my model capture? | R squared |
| How much does the outcome change per unit of the predictor? | The slope, not either of these |
A few practical points follow from that split. Correlation is symmetric: the correlation between hours studied and exam score is the same as the correlation between exam score and hours studied. R squared is not symmetric in meaning, because it describes a model predicting a specific outcome, so swapping predictor and outcome changes the question. With two or more predictors, R squared still exists but r does not, since there is no single pair of variables left to correlate.
Direction is the detail people drop most often. If you report only R squared, a reader cannot tell whether the outcome rises or falls as the predictor rises. Report r when direction matters, and report R squared when the goal is judging fit. Neither number proves that one variable causes the other, and neither detects a curved relationship on its own, so a scatterplot should come before either statistic.
What R and R-Squared Mean
Start with r, the Pearson correlation coefficient. It is a single number that summarizes how tightly two variables follow a straight line. A value near +1 means that as one variable rises, the other rises in a nearly linear way. A value near -1 means one rises as the other falls. A value near 0 means there is little linear association.
The precise definition is the covariance of the two variables divided by the product of their standard deviations:
$$r = \frac{\text{cov}(x,y)}{s_x s_y}$$
This standardization is what keeps r between -1 and +1 regardless of the units involved. Correlation coefficients are widely used in medicine and the social sciences to summarize relationships between measurements [1][2].
R², the coefficient of determination, answers a different question. It asks how much of the total variation in the outcome variable is explained by the model. In simple linear regression with one predictor, R² is exactly r squared. With more than one predictor, R² still exists but r does not, because there is no single pair of variables to correlate.
How It Works
The formula for R² comes from comparing two sums of squares:
$$R^2 = 1 - \frac{SS_{res}}{SS_{tot}}$$
- $SS_{res}$ is the residual sum of squares, the squared vertical distances between the observed values and the fitted line.
- $SS_{tot}$ is the total sum of squares, the squared distances between the observed values and the mean of the outcome.
- The ratio $SS_{res}/SS_{tot}$ is the share of variation left unexplained. Subtracting it from 1 gives the share explained.
In simple linear regression, this quantity equals the square of the correlation between the observed outcome and the fitted values, which is why it is written R². When there is only one predictor, that value is also $r^2$, the square of the Pearson correlation between the predictor and the outcome.
The relationship between the two numbers is direct. Squaring r removes its sign, so R² is always non-negative. An r of -0.80 and an r of +0.80 both give an R² of 0.64. If you only report R², you lose the direction of the relationship.
Worked Example
Ten students recorded hours studied and exam score. The data are small enough to check by hand.
| hours | score |
|---|---|
| 1 | 52 |
| 2 | 58 |
| 3 | 63 |
| 4 | 68 |
| 5 | 72 |
| 6 | 76 |
| 7 | 81 |
| 8 | 85 |
| 9 | 89 |
| 10 | 94 |
The steps run as follows.
- n (pairs): 10
- mean hours: 5.5000
- mean score: 73.8000
- SD hours (n-1): 3.0277
- SD score (n-1): 13.7421
- covariance (n-1): 41.5556
- r = cov/(sx*sy): 41.5556 / (3.0277 * 13.7421) = 0.9988
- R² = r²: 0.9988² = 0.9976
- slope: 4.5333
- intercept: 48.8667
- SS_res: 4.1333
- SS_tot: 1699.6000
- R² = 1 - SS_res/SS_tot: 1 - 4.1333/1699.6000 = 0.9976
Both routes to R² agree at 0.9976. The fitted line is score = 48.8667 + 4.5333 × hours, so each extra hour of study is associated with about 4.53 more points.
Here is the same calculation in Python.
import numpy as np
from scipy import stats
hours = [1,2,3,4,5,6,7,8,9,10]
scores = [52,58,63,68,72,76,81,85,89,94]
r = np.corrcoef(hours, scores)[0,1]
r2 = r**2
slope, intercept, *_ = stats.linregress(hours, scores)
print(r, r2)  # 0.9988 0.9976
Output:
0.9987832874195888 0.9975680552286809The scatterplot of these ten points with the fitted line shows r = 1.00 and R² = 1.00 when rounded to two decimals, which is a reminder that rounding can hide small differences.
How to Interpret It
Read r first when you care about direction and strength. A positive r means the two variables move together. A negative r means they move in opposite directions. The magnitude tells you how close the points sit to a straight line. Values near ±1 indicate a tight linear pattern, values near 0 indicate a weak one. For guidance on ranking magnitudes, see this guide to interpreting correlation coefficients.
Read R² when you care about prediction. An R² of 0.9976 means the model explains 99.76% of the variation in exam scores. An R² of 0.30 means 70% of the variation is still unexplained. The coefficient of determination is the natural summary when the goal is to judge how well a model fits.
The two numbers answer different questions. In the example, r = 0.9988 tells you hours and scores are almost perfectly linearly related. R² = 0.9976 tells you that knowing hours studied leaves almost no variation in scores unaccounted for. Both are true and both are useful, but they are not interchangeable.
When to Use It (and when not to)
Use r when you have two continuous variables and you want a quick, unit-free summary of their linear association. It is symmetric, so it does not matter which variable you call x and which you call y. It is also the right choice when you have no model and simply want to describe a relationship.
Use R² when you have fitted a regression model and want to report how much of the outcome's variation the model captures. It applies to ordinary least squares regression with one or many predictors, and it is the standard fit statistic in most regression output.
Avoid r when the relationship is clearly curved. A strong U-shaped relationship can produce an r near 0 because the linear component is weak. Avoid R² as a sole measure of model quality, because it always rises when you add predictors, even useless ones. The adjusted R-squared corrects for that.
R and R-Squared vs Correlation and Covariance
Covariance and correlation are close relatives, and R² sits one step further along.
| Measure | Range | Units | Symmetric | What it tells you |
|---|---|---|---|---|
| Covariance | unbounded | product of x and y units | yes | Direction of linear association |
| r | -1 to +1 | none | yes | Strength and direction of linear association |
| R² | 0 to 1 | none | no (model context) | Share of outcome variation explained |
Covariance depends on scale, so it is hard to compare across studies. Correlation removes the scale. R² removes the direction and reframes the number as a proportion of explained variation.
Common Mistakes
- Reporting R² when you mean r. If you want to state that two variables move together and in which direction, report r. The fix is to name the statistic you are using and check whether the sign matters for your claim.
- Assuming a high R² proves causation. A model can fit well and still be confounded. The fix is to treat R² as a fit measure, not evidence about cause.
- Comparing R² across models with different outcome variables. R² is tied to the variance of the outcome, so it is not comparable when the outcome changes. The fix is to compare models on the same outcome.
- Ignoring curvature. A linear fit can show a low R² even when a strong nonlinear pattern exists. The fix is to plot the data and consider a quadratic regression or another curved form.
- Treating R² as a quality score with a universal cutoff. There is no threshold that makes a model good in every field. The fix is to judge R² against the noise level and purpose of your data.
- Forgetting that R² never decreases when predictors are added. The fix is to report adjusted R² alongside R² when comparing models with different numbers of predictors.
Limitations
R² says nothing about whether the model is correctly specified. A high R² can come from a model that violates linearity, independence, or constant-variance assumptions. It also says nothing about prediction error in new data, which can be much larger than the in-sample fit suggests.
Neither r nor R² detects nonlinear relationships on its own. Two variables can have a perfect curved relationship and still produce a modest r. Always plot your data before trusting either number. For a related diagnostic view, see residual sum of squares, which is the quantity behind the R² formula.
Reading the Two Numbers Together
The fastest way to stop mixing up r and R squared is to treat them as answers to different questions asked about the same scatterplot. One describes the pattern of the points. The other describes how much of the outcome's spread a fitted line removes.
The same data, two summaries
Picture a scatterplot of ten points climbing steadily from lower left to upper right, hugging a straight line closely. The correlation r is close to +1 because the points are tight and the trend is upward. The R squared is close to 1 as well, because a line through those points leaves almost none of the vertical spread unexplained.
Now picture a second scatterplot with the same tightness but sloping downward. The correlation is close to -1. The R squared is again close to 1. The fit is just as good; only the direction flipped. This is the cleanest demonstration that R squared cannot tell you which way the relationship runs.
What each number leaves out
r leaves out the scale of the outcome. It does not tell you whether a one-unit rise in the predictor moves the outcome by a hair or by a mile. The slope carries that information, which is why a regression report usually gives r or R squared alongside the slope and intercept, not instead of them.
R squared leaves out direction and also leaves out the size of the errors in the outcome's own units. A model can explain 90 percent of the variation and still miss individual predictions by an amount that matters in practice. The residual standard deviation, which is in the outcome's units, fills that gap.
A quick numeric comparison
Suppose a model has an R squared of 0.49. The correlation between predictor and outcome is therefore either +0.70 or -0.70, since both square to 0.49. Without seeing the sign, you know the linear relationship is moderately strong but you cannot say whether the outcome tends to rise or fall with the predictor. If the slope is positive, r is +0.70; if negative, r is -0.70. The R squared is identical either way.
Worked Comparisons and a Diagram in Words
Same r, different R squared
Take two predictors measured on the same outcome. Predictor A has r = 0.60 with the outcome, so its simple regression has R squared = 0.36. Predictor B has r = 0.80, so its R squared = 0.64. Doubling the apparent strength from 0.60 to 0.80 does not double the explained share; it raises it from 36 percent to 64 percent. This is why R squared values often look surprisingly low next to correlations that sound impressive.
Same R squared, different stories
Two studies both report R squared = 0.25. In the first, the outcome is a lab measurement with very little natural noise, and the model is missing an important driver. In the second, the outcome is a noisy behavioral score where many small influences combine, and 25 percent explained is a solid result. The number alone cannot distinguish these cases. Context, the noise level of the measurement, and the purpose of the model all matter.
The geometry behind the formula
Imagine a vertical line through the mean of the outcome. Every point sits some distance above or below that line, and the total sum of squares adds up all those squared distances. That total is the variation you start with.
Now draw the fitted regression line. Each point now sits some distance from the fitted line instead, and the residual sum of squares adds up those squared distances. The fitted line is chosen to make this second total as small as possible.
R squared is the fraction of the original spread that disappeared when you switched from the mean line to the fitted line. If the fitted line passes through every point, the residual total is zero and R squared is 1. If the fitted line is no better than the mean line, the two totals are equal and R squared is 0. In simple regression the fitted line is never worse than the mean line, which is why R squared cannot fall below 0 in that setting.
A small table of paired values
| r | R squared | Plain reading |
|---|---|---|
| 0.00 | 0.00 | No linear trend; the fitted line explains nothing |
| 0.30 | 0.09 | Weak linear trend; about 9 percent of variation explained |
| 0.50 | 0.25 | Moderate trend; a quarter of the variation explained |
| 0.71 | 0.50 | About half the variation explained |
| 0.90 | 0.81 | Strong trend; most variation explained |
| -0.90 | 0.81 | Strong downward trend; same explained share |
The last two rows are the point of the table. The explained share is identical; only the direction differs.
Misconceptions Worth Clearing Up
"A high R squared means the predictions are accurate"
It means the model fits the data it was built on. Predictions on new data can be far worse if the relationship shifts or the model has been overfitted to quirks in the sample. A model with a modest R squared that holds up on fresh data can be more useful than one with a high R squared that collapses outside the original sample.
"R squared and r are interchangeable because one is the square of the other"
They are linked only in simple linear regression. Add a second predictor and R squared still has a clear meaning, but there is no single r to square. Reporting "r = 0.80" for a three-predictor model is simply wrong, because no such single correlation exists.
"A low R squared means the variables are unrelated"
It means the straight-line component is weak. A strong curved pattern, such as a U shape, can produce an r near 0 and a low R squared while the variables are tightly related in a non-linear way. Plot first, then compute.
"R squared always goes up, so a higher value means a better model"
Adding any predictor, even an irrelevant one, cannot lower R squared in ordinary least squares on the same data. That makes raw R squared a poor tool for comparing models with different numbers of predictors. Adjusted R squared penalizes extra predictors and is the fairer comparison.
"The sign of R squared tells you the direction"
It does not, because R squared is never negative in a standard fit. Direction lives in r or in the slope. If a report shows a negative R squared, it is either adjusted R squared or a value computed on new data with a fixed model, not the ordinary in-sample statistic.
Correlation and R Squared in Practice
Choosing what to report
If your study asks whether two measurements track each other, report r with a confidence interval and a scatterplot. If your study asks how well a set of predictors explains an outcome, report R squared, adjusted R squared if predictors differ in number across models, and the residual standard deviation so readers can judge error size in real units.
Reporting both when both matter
Many analyses benefit from both numbers stated plainly. For example: "Study hours correlated strongly with exam score (r = 0.9988), and a linear model on hours explained 99.76 percent of the variation in scores (R squared = 0.9976)." That sentence gives direction, strength, and explained share without ambiguity, and it makes clear which statistic answers which question.
Frequently Asked Questions
Is R-squared the same as r?
In simple linear regression with one predictor, yes, R² equals r squared. With two or more predictors, R² still exists but r does not, because there is no single pair of variables to correlate. So R² is the more general statistic.
Can R-squared be negative?
Not for a model with an intercept fitted by ordinary least squares on the same data used to compute the total sum of squares. R² is bounded between 0 and 1 in that setting. Adjusted R² can be negative, and R² computed on new data with a fixed model can also be negative.
What is a good R-squared value?
It depends on the field and the question. In tightly controlled physical measurements, values above 0.95 are common. In noisy social or biological data, 0.30 can be meaningful. Judge R² against the variability inherent in your measurements, not against a fixed cutoff.
Does a high R-squared mean the model predicts well?
Not necessarily. A high R² means the model fits the data it was built on. Prediction on new data depends on whether the same relationship holds and whether the model is not overfitted. Check performance on held-out data before making that claim.
How do I get r and R-squared in code?
In Python, np.corrcoef returns the correlation matrix and scipy.stats.linregress returns the slope, intercept, and r value. Squaring r gives R² for a simple regression. In R, cor() gives r and summary() on a fitted lm object reports both R² and adjusted R².
References
- Bland JM, Altman DG. Bland JM, Altman DG (1995). Statistics notes: Calculating correlation coefficients with repeated observations: Part 1, correlation within subjects. BMJ
- Bland JM, Altman DG. Bland JM, Altman DG (1995). Calculating correlation coefficients with repeated observations: Part 2, correlation between subjects. BMJ
Further Reading
- Cronbach LJ. Cronbach LJ (1951). Coefficient Alpha and the Internal Structure of Tests. Psychometrika
- NIST/SEMATECH e-Handbook of Statistical Methods
- Altman N, Krzywinski M. Altman N, Krzywinski M (2015). Simple linear regression. Nature Methods
- OpenStax. Introductory Statistics 2e
Related Articles
- Adjusted R-Squared vs R-Squared: Differences and Examples
- Coefficient of Determination (R-Squared): Definition and Examples
- R transform Function: Syntax and Examples
- Mean and Standard Deviation: Definition, Formula and Examples
- Fitted Values in R: How to Extract and Interpret Them
- Which R-Value Represents the Strongest Correlation? A Guide to Interpreting Correlation Coefficients
- P-Value Formula and Interpretation: A Researcher
- How to Interpret a Bradford Assay Standard Curve: Linearity, R², and Outliers