How to Get Data Analysis ToolPak in Excel (Step by Step)
By Dr. Zubair Khalid, DVM, MS, PhD ·
If you want to know how to get Data Analysis in Excel, the answer is that you turn on an add-in called the Analysis ToolPak. It ships with Excel but stays switched off until you enable it. Once it is on, a Data Analysis button appears on the Data tab, and that button opens the full set of statistical tools.
Quick Answer
- The Data Analysis command comes from the Analysis ToolPak add-in, which is included with Excel but not enabled by default [1].
- On Windows, go to File > Options > Add-ins, set Manage to Excel Add-ins, click Go, check Analysis ToolPak, and click OK [1][2].
- On Mac, go to Tools > Excel Add-ins, check Analysis ToolPak, and click OK [1][2].
- After enabling it, the Data Analysis command appears on the Data tab [1][2].
- If Analysis ToolPak is missing from the list, click Browse to locate it, and click Yes if Excel asks to install it [1][2].
Before You Start
You do not need to install anything extra in most cases. The Analysis ToolPak is a built-in add-in, so the whole process is a settings change. You do need a version of Excel that supports it, and the Microsoft documentation lists Excel for Microsoft 365, Excel 2024, Excel 2021, Excel 2019, and Excel 2016, on both Windows and Mac [2].
Two practical points before you click anything. First, the add-in works on one worksheet at a time. If you run an analysis on grouped worksheets, the results land on the first worksheet and the remaining sheets get empty formatted tables, so you have to recalculate the tool for each sheet [1][2]. Second, the ToolPak displays in English when your language is not supported [1].
If you are new to the wider workflow, it helps to see how to analyse data in Excel step by step before you start running individual tools.
Step by Step
These are the Windows steps, which match the current Microsoft documentation [1][2].
- Open Excel and select the File tab.
- Select Options.
- Select the Add-Ins category.
- In the Manage box, select Excel Add-ins, then select Go.
- In the Add-Ins box, check the Analysis ToolPak check box, then select OK.
- If Analysis ToolPak is not listed in the Add-Ins available box, select Browse to locate it.
- If you are prompted that the Analysis ToolPak is not currently installed on your computer, select Yes to install it.
- Go to the Data tab. The Data Analysis command is now available [1].
On Mac, the path is different. Select the Tools menu, then Excel Add-ins. In the Add-Ins available box, check Analysis ToolPak, then select OK. If it is not listed, select Browse to locate it, and select Yes if you get the install prompt [1][2].
If you also want the VBA functions that come with the ToolPak, load the Analysis ToolPak - VBA add-in the same way, by checking that box in the Add-ins available list [1].
Worked Example
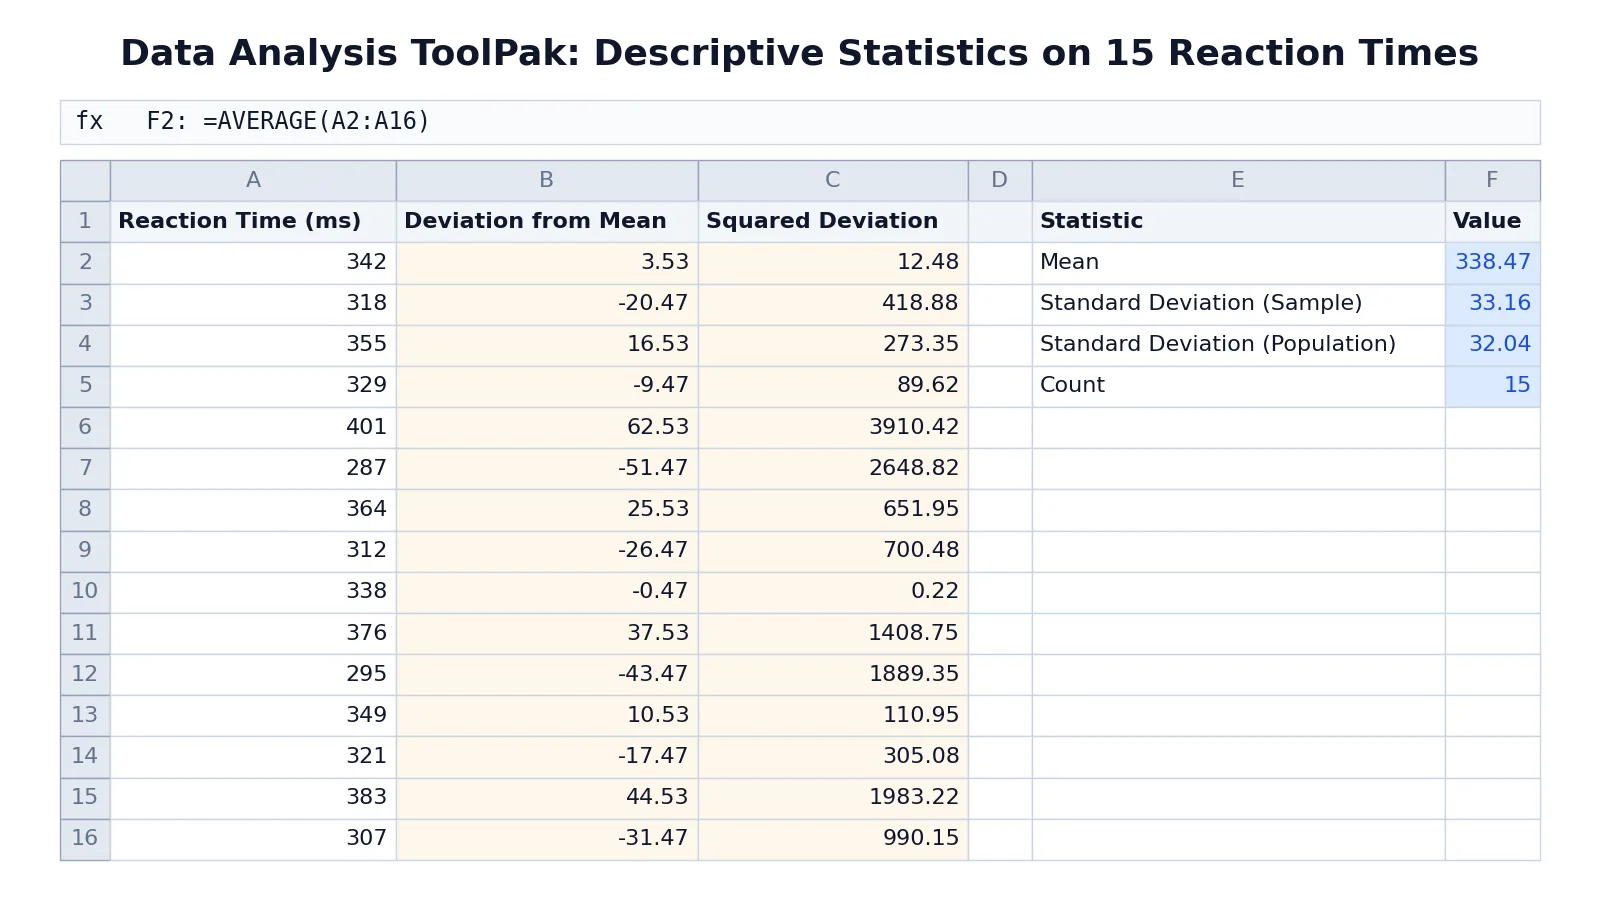
Say you measured reaction time in milliseconds for 15 participants and stored the values in column A. You want the mean and standard deviation without writing the formulas yourself.
| Row | A | B | C | E | F |
|---|---|---|---|---|---|
| 1 | Reaction Time (ms) | Deviation from Mean | Squared Deviation | Statistic | Value |
| 2 | 342 | =A2-AVERAGE($A$2:$A$16) -> displays 3.53 | =B2^2 -> displays 12.48 | Mean | =AVERAGE(A2:A16) -> displays 338.47 |
| 3 | 318 | =A3-AVERAGE($A$2:$A$16) -> displays -20.47 | =B3^2 -> displays 418.88 | Standard Deviation (Sample) | =STDEV.S(A2:A16) -> displays 33.16 |
| 4 | 355 | =A4-AVERAGE($A$2:$A$16) -> displays 16.53 | =B4^2 -> displays 273.35 | Standard Deviation (Population) | =STDEV.P(A2:A16) -> displays 32.04 |
| 5 | 329 | =A5-AVERAGE($A$2:$A$16) -> displays -9.47 | =B5^2 -> displays 89.62 | Count | =COUNT(A2:A16) -> displays 15 |
| 6 | 401 | =A6-AVERAGE($A$2:$A$16) -> displays 62.53 | =B6^2 -> displays 3910.42 | ||
| 7 | 287 | =A7-AVERAGE($A$2:$A$16) -> displays -51.47 | =B7^2 -> displays 2648.82 | ||
| 8 | 364 | =A8-AVERAGE($A$2:$A$16) -> displays 25.53 | =B8^2 -> displays 651.95 | ||
| 9 | 312 | =A9-AVERAGE($A$2:$A$16) -> displays -26.47 | =B9^2 -> displays 700.48 | ||
| 10 | 338 | =A10-AVERAGE($A$2:$A$16) -> displays -0.47 | =B10^2 -> displays 0.22 | ||
| 11 | 376 | =A11-AVERAGE($A$2:$A$16) -> displays 37.53 | =B11^2 -> displays 1408.75 | ||
| 12 | 295 | =A12-AVERAGE($A$2:$A$16) -> displays -43.47 | =B12^2 -> displays 1889.35 | ||
| 13 | 349 | =A13-AVERAGE($A$2:$A$16) -> displays 10.53 | =B13^2 -> displays 110.95 | ||
| 14 | 321 | =A14-AVERAGE($A$2:$A$16) -> displays -17.47 | =B14^2 -> displays 305.08 | ||
| 15 | 383 | =A15-AVERAGE($A$2:$A$16) -> displays 44.53 | =B15^2 -> displays 1983.22 | ||
| 16 | 307 | =A16-AVERAGE($A$2:$A$16) -> displays -31.47 | =B16^2 -> displays 990.15 |
The mean formula is the same calculation the ToolPak runs behind the scenes:
$$\bar{x} = \frac{\sum_{i=1}^{n} x_i}{n} = 338.47$$
The sample standard deviation uses $n-1$ in the denominator:
$$s = \sqrt{\frac{\sum_{i=1}^{n}(x_i - \bar{x})^2}{n-1}} = 33.16$$
The population version divides by $n$ instead:
$$\sigma = \sqrt{\frac{\sum_{i=1}^{n}(x_i - \bar{x})^2}{n}} = 32.04$$
To get these from the ToolPak, follow these interface steps.
- Go to File > Options > Add-ins.
- In the Manage box, select Excel Add-ins, then click Go.
- Check Analysis ToolPak, then click OK.
- Go to Data tab > Analysis group > Data Analysis.
- Select Descriptive Statistics, then click OK.
- For Input Range, type A2:A16. Check Labels in first row if your range includes a header. Choose Output Range and enter an empty cell such as H1, so the output does not overwrite the formulas in E1:F5. Check Summary statistics, then click OK.
The output table reports the mean as 338.47, the standard deviation as 33.16 and the count as 15. Those match the formulas in F2, F3 and F5 exactly, which is a good way to confirm the add-in is working. Descriptive Statistics reports only the sample standard deviation, so the population value of 32.04 comes from STDEV.P alone. If you want to check the arithmetic by hand first, how to calculate the mean in Excel step by step walks through the same average.
Other Ways to Do It
The ToolPak is not the only route to the same numbers. Excel has native functions for most of what it does, and they update automatically when your data changes, which the ToolPak output does not.
For a single statistic, a formula is faster. =AVERAGE(A2:A16) gives the mean, =STDEV.S(A2:A16) gives the sample standard deviation, and =COUNT(A2:A16) gives the count. For relationships between two variables, how to calculate correlation coefficient in Excel step by step covers the function approach.
The ToolPak earns its place when you want a full output table in one action, such as a regression summary, an ANOVA table, or a histogram with a chart. Those are tedious to build by hand and the ToolPak produces them in a single dialog.
Troubleshooting
The Data Analysis button is not on the Data tab. The add-in is not enabled. Repeat the File > Options > Add-ins path and confirm the Analysis ToolPak box is checked [1][2].
Analysis ToolPak is not in the Add-Ins available list. Select Browse to locate it [1][2]. If Excel then says it is not currently installed, select Yes to install it [1][2].
The button disappeared after it worked before. Add-ins can be disabled by a crash or by another add-in conflict. Re-check the box in the Add-Ins dialog.
Results appear on the wrong sheet. The ToolPak works on one worksheet at a time. On grouped worksheets, results go to the first sheet and the rest get empty formatted tables. Recalculate the tool for each sheet [1][2].
The dialog is in English but your Excel is not. That is expected. The ToolPak displays in English when your language is not supported [1].
Common Mistakes
- Checking the box in the wrong Manage category. The Manage box must be set to Excel Add-ins before you click Go. If it is set to COM Add-ins, Analysis ToolPak will not appear [1][2]. Fix: change the dropdown first.
- Forgetting to include the header row setting. If your input range includes a header and you do not check Labels in first row, Excel treats the text as data and the output is wrong. Fix: check the box whenever row 1 holds column names.
- Overwriting existing data with the output. Choosing an Output Range that already contains values replaces them if you click OK on Excel's overwrite prompt. Fix: point the output at an empty area, or use New Worksheet Ply.
- Assuming the output updates. ToolPak results are static values. Change the input and the table stays as it was. Fix: rerun the tool, or use native formulas when you need live results.
- Running the tool on grouped sheets. You get results on the first sheet and empty tables on the others [1][2]. Fix: ungroup the sheets and run the analysis on each one.
- Confusing sample and population standard deviation. Descriptive Statistics reports only the sample version, which divides by $n-1$. Fix: use it when your data is a sample from a larger group, and use STDEV.P when the data is the whole population.
Limitations
The Analysis ToolPak is a calculation aid, not a statistics teacher. It will happily run a test on data that violates the test's assumptions, and it will not warn you. Normality, independence, equal variances, and sample size all matter, and none of them are checked for you. The output is also static, so it can drift out of sync with your source data without any visible sign.
There is a scope limit too. The data analysis functions work on only one worksheet at a time, and grouped worksheets produce results on the first sheet with empty formatted tables on the rest [1][2]. Some languages are not supported, and the ToolPak displays in English in those cases [1]. If you need reproducible, auditable analysis, native formulas or a scripting approach will serve you better over the long run.
Frequently Asked Questions
Where is Data Analysis on Excel?
It is on the Data tab, in the Analysis group, and it only appears after you enable the Analysis ToolPak add-in [1][2]. If you do not see it, the add-in is off. Enable it through File > Options > Add-ins, set Manage to Excel Add-ins, click Go, and check the box.
Why can I not find Data Analysis in Excel?
The most common reason is that the add-in was never enabled, since it is off by default. The second most common reason is that the Manage dropdown was left on COM Add-ins instead of Excel Add-ins [1][2]. If Analysis ToolPak is not in the list at all, click Browse to locate it [1][2].
Do I need to install anything to get the Analysis ToolPak?
No separate download is needed in most cases. The add-in is included with Excel, and enabling it is a settings change. If Excel reports that it is not currently installed on your computer, select Yes and it installs from the existing installation files [1][2].
What can I do with the Data Analysis ToolPak?
It covers descriptive statistics, correlation, regression, t-tests, z-tests, ANOVA, histograms, moving averages, exponential smoothing, Fourier analysis, and more [2]. You supply the data and parameters, and the tool calculates results into an output table, sometimes with charts [2].
Does the Analysis ToolPak work on Mac?
Yes. On Mac, select the Tools menu, then Excel Add-ins, check Analysis ToolPak, and select OK. If it is not listed, select Browse to locate it, and select Yes if you get the install prompt [1][2]. The Data Analysis command then appears on the Data tab.
If you want to see how the ToolPak fits into a full project, how to analyse data in Excel step by step and what is data analysis both put the individual tools in context.
References
- Load the Analysis ToolPak in Excel | Microsoft Support
- Use the Analysis ToolPak to perform complex data analysis | Microsoft Support
Further Reading
- Broman KW, Woo KH (2018). Data Organization in Spreadsheets. The American Statistician
- Ziemann M, Eren Y, El-Osta A (2016). Gene name errors are widespread in the scientific literature. Genome Biology
- Microsoft Support: Excel help and learning
- McCullough B, Heiser DA (2008). On the accuracy of statistical procedures in Microsoft Excel 2007. Computational Statistics & Data Analysis
Related Articles
- How to Analyse Data in Excel: Step by Step
- How to Calculate Correlation Coefficient in Excel (Step by Step)
- How to Find and Search in Excel (Step by Step)
- How to Calculate the Mean in Excel (Step by Step)
- What Is Data Analysis? Definition, Steps and Examples
- How to Create a Data Extraction Form in Excel for a Systematic Review