Levels of Measurement: Nominal, Ordinal, Interval and Ratio
By Dr. Zubair Khalid, DVM, MS, PhD ·
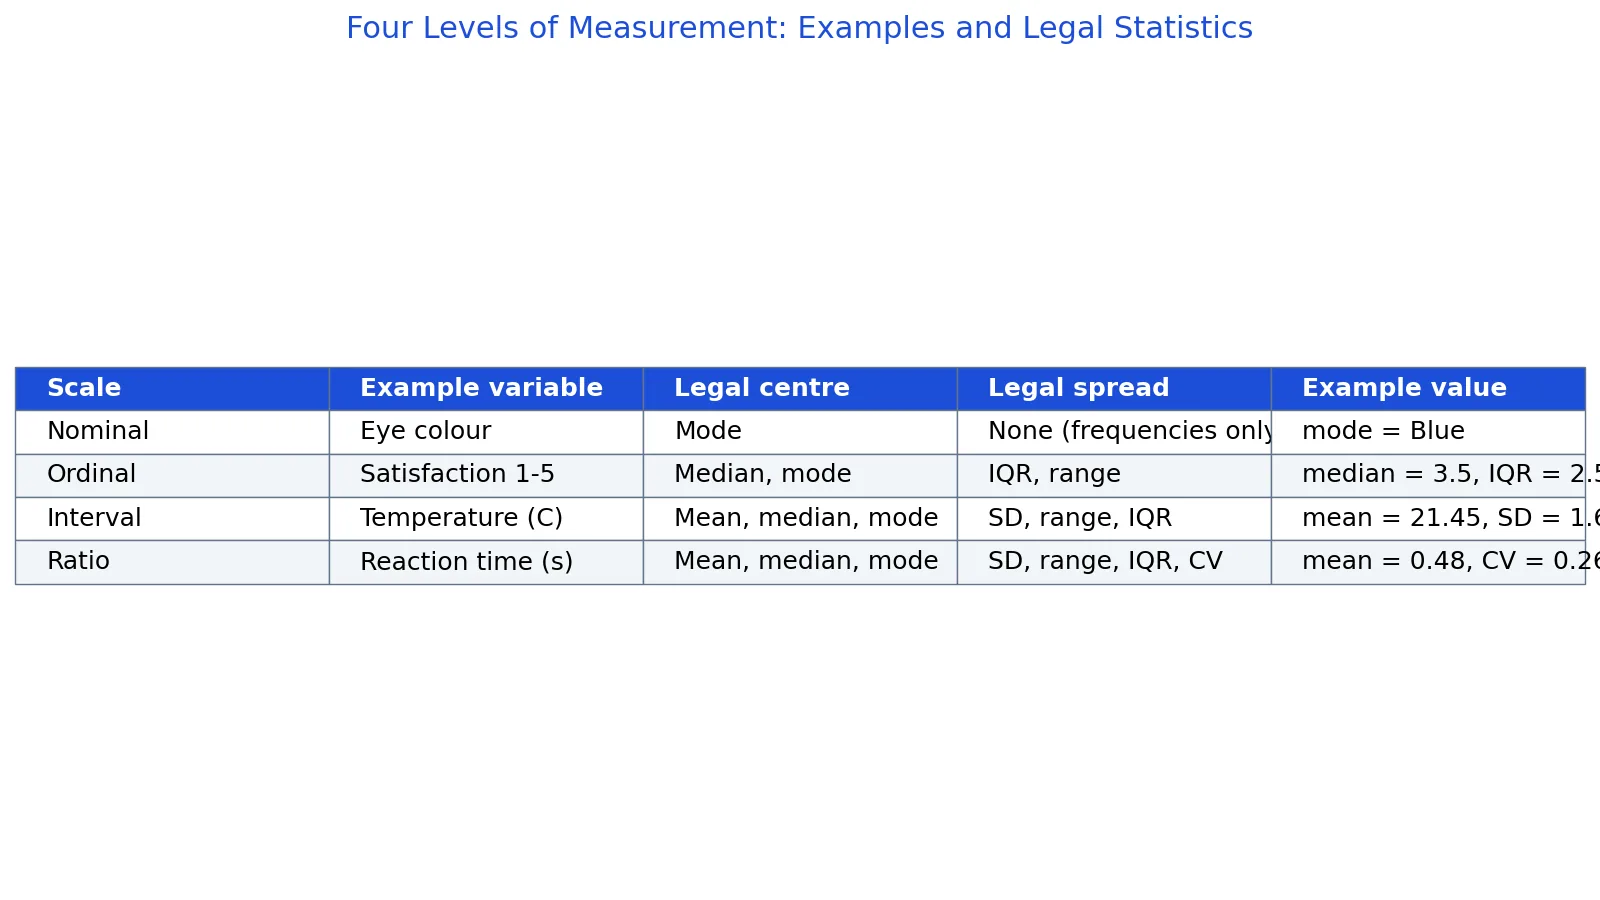
The four levels of measurement nominal ordinal interval and ratio describe how much information the values of a variable carry. Nominal values are labels only, ordinal values can be ranked, interval values have equal spacing but no true zero, and ratio values have equal spacing plus a true zero. The level of measurement decides which statistics are legal, so it is the first thing to check before you compute anything [1].
Quick Answer
- Nominal: names or categories only. No order. Legal statistics: counts, proportions, mode.
- Ordinal: categories you can rank, but gaps between ranks are not equal. Legal statistics: median, mode, quartiles, IQR.
- Interval: equal distances between values, no true zero. Legal statistics: mean, standard deviation, range, correlation.
- Ratio: equal distances plus a true zero. Legal statistics: everything above plus ratios, coefficient of variation, geometric mean.
- The scale of measurement nominal ordinal interval ratio is a hierarchy. Each level keeps the properties of the ones below it and adds one more [2].
What Levels of Measurement Mean
In plain terms, the level of measurement is the amount of mathematical structure in your data. Eye color is a label. Satisfaction ratings are a ranking. Temperature in Celsius is a number line. Reaction time is a number line that starts at a real zero.
The precise statistical definition: a level of measurement, or scale of measure, is a classification that describes the nature of information within the values assigned to variables [3]. Psychologist Stanley Smith Stevens developed the best-known version of this classification with four levels: nominal, ordinal, interval, and ratio [3]. The framework started in psychology and has since been adopted, extended, and criticized across disciplines [3].
The practical consequence is simple. Not every statistical operation can be used with every set of data, and correct procedures depend on the researcher knowing the level of measurement [1].
How It Works
Each level is defined by which operations preserve meaning. Here is the mechanism in formula form.
For a nominal variable, the only legal summary is frequency:
$$p_k = \frac{n_k}{N}$$
where $n_k$ is the count in category $k$ and $N$ is the total number of observations. The mode is the category with the largest $n_k$.
For an ordinal variable, you can use order statistics. The median is the middle value of the sorted data:
$$\text{median} = \frac{x_{(n/2)} + x_{(n/2+1)}}{2} \quad \text{(even } n\text{)}$$
where $x_{(i)}$ is the $i$-th value after sorting. The interquartile range is $Q_3 - Q_1$.
For interval and ratio variables, the arithmetic mean is legal:
$$\bar{x} = \frac{1}{n}\sum_{i=1}^{n} x_i$$
The sample standard deviation is:
$$s = \sqrt{\frac{\sum_{i=1}^{n}(x_i - \bar{x})^2}{n-1}}$$
The difference between interval and ratio shows up in one extra formula. The coefficient of variation divides the standard deviation by the mean:
$$CV = \frac{s}{\bar{x}}$$
This is only meaningful when zero means "none of the quantity." With a true zero, the ratio of two values is also meaningful, so $\frac{\max}{\min}$ is a legal statistic.
Worked Example
Take a 10-row survey dataset with one variable per measurement scale: EyeColour (nominal), Satisfaction on a 1 to 5 scale (ordinal), TempC (interval), and ReactionTime in seconds (ratio).
| ID | EyeColour | Satisfaction | TempC | ReactionTime |
|---|---|---|---|---|
| 1 | Brown | 5 | 21.5 | 0.42 |
| 2 | Blue | 4 | 22.1 | 0.38 |
| 3 | Green | 3 | 20.8 | 0.51 |
| 4 | Brown | 5 | 23.4 | 0.35 |
| 5 | Hazel | 2 | 19.9 | 0.62 |
| 6 | Blue | 4 | 22.7 | 0.44 |
| 7 | Brown | 1 | 18.6 | 0.71 |
| 8 | Green | 3 | 21.2 | 0.49 |
| 9 | Blue | 5 | 24.0 | 0.33 |
| 10 | Hazel | 2 | 20.3 | 0.58 |
Nominal step. Count each category: Brown = 3, Blue = 3, Green = 2, Hazel = 2. Brown and Blue tie at 3, so the variable has two modes, Brown and Blue. That is the only legal measure of center here.
Ordinal step. Sort the satisfaction values: 1, 2, 2, 3, 3, 4, 4, 5, 5, 5. With $n = 10$, the median is the average of positions 5 and 6, which is $(3 + 4) / 2 = 3.5$. For the quartiles, $k = (n-1) \times 0.25 = 2.25$, so $Q_1 = 2.2500$. For $Q_3$, $k = (n-1) \times 0.75 = 6.75$, so $Q_3 = 4.7500$. The IQR is $4.7500 - 2.2500 = 2.5000$. The mode is 5.
Interval step. The temperature values sum to 214.5, so the mean is $214.5 / 10 = 21.4500$. The sample standard deviation is 1.6541 and the range is $24.0 - 18.6 = 5.4000$. Converting to Fahrenheit uses $F = C \times \frac{9}{5} + 32$, which gives a mean of 70.6100. The conversion is linear, and the scale still has no true zero.
Ratio step. Reaction times sum to 4.83, so the mean is $4.83 / 10 = 0.4830$ seconds. The sample standard deviation is 0.1238. Because zero seconds means no elapsed time, the coefficient of variation is legal: $CV = 0.1238 / 0.4830 = 0.2564$. The ratio of the slowest to the fastest time is $0.71 / 0.33 = 2.1515$.
Here is the code that produced these values.
import pandas as pd, statistics
df = pd.DataFrame({
  'EyeColour':['Brown','Blue','Green','Brown','Hazel','Blue','Brown','Green','Blue','Hazel'],
  'Satisfaction':[5,4,3,5,2,4,1,3,5,2],
  'TempC':[21.5,22.1,20.8,23.4,19.9,22.7,18.6,21.2,24.0,20.3],
  'ReactionTime':[0.42,0.38,0.51,0.35,0.62,0.44,0.71,0.49,0.33,0.58]})
print(df['EyeColour'].value_counts().to_dict())
print(df['Satisfaction'].median(), df['Satisfaction'].quantile([.25,.75]).tolist())
print(df['TempC'].mean(), df['TempC'].std(ddof=1))
print(df['ReactionTime'].mean(), df['ReactionTime'].std(ddof=1))
Output:
{'Brown': 3, 'Blue': 3, 'Green': 2, 'Hazel': 2}
3.5 [2.25, 4.75]
21.45 1.654119436773267
0.483 0.12383232390795404
How to Interpret It
Read the level of measurement as a permission list. If a variable is nominal, the mode is your only center and a bar chart is your main visual. If it is ordinal, the median and IQR describe the middle and spread, and the mean is usually misleading because the gaps between ranks are not equal [1].
For interval data, the mean and standard deviation are valid because equal differences mean equal amounts of the underlying quantity. Temperature is the classic case. The same difference between 100 and 90 degrees exists between 42 and 32 degrees [2].
For ratio data, you can go one step further and compare magnitudes. A reaction time of 0.71 seconds is 2.15 times a reaction time of 0.33 seconds. You cannot say that about Celsius temperatures, because 20°C is not "twice as warm" as 10°C on any physical scale with a true zero.
When to Use It (and when not to)
Use the four levels when you are choosing statistics, picking a chart, or deciding between a parametric and a nonparametric test. The level of measurement is the first filter. If you have ordinal data, rank-based tests fit the data structure better than tests that assume equal intervals.
Do not use the framework as a rigid law. The levels are a classification tool, not a physical property of the world. Some scholars have criticized or rejected Stevens's framework, and other classifications exist [3]. Extended levels such as log-interval and cyclical ratio measurements do not fit the original four cleanly [3]. Treat the levels as a practical guide for what your numbers can support.
Levels of Measurement vs Variable Types
People often mix up "level of measurement" with "type of data." They overlap, but they answer different questions. The level tells you what operations are legal. The type tells you whether the variable is categorical or numeric.
| Question | Level of measurement | Variable type |
|---|---|---|
| What does it describe? | Mathematical structure of values | Categorical or numeric nature |
| Example answer | "Ordinal" | "Categorical" |
| Decides | Which statistics are valid | Which charts and models fit |
| Eye colour | Nominal | Categorical |
| Satisfaction 1 to 5 | Ordinal | Categorical (ordered) |
| Temperature in Celsius | Interval | Numeric, continuous |
| Reaction time | Ratio | Numeric, continuous |
A variable can be numeric and still ordinal if the spacing is not meaningful. A 1 to 5 satisfaction score is stored as a number, but the distance from 1 to 2 need not equal the distance from 4 to 5.
Common Mistakes
- Averaging ordinal ratings without thinking. The mean of a 1 to 5 satisfaction scale assumes equal gaps. Fix: report the median and IQR, or justify the mean explicitly.
- Treating Celsius or Fahrenheit as ratio. "Twice as hot" is meaningless on these scales. Fix: convert to Kelvin if you need ratios.
- Assuming numeric codes make data interval. Coding gender as 0 and 1 does not create a quantity. The value 1 is not greater than 0 in any real sense [2]. Fix: check whether the differences mean anything.
- Using the mode as the only summary for ordinal data. It throws away the ranking. Fix: add the median and quartiles.
- Computing a coefficient of variation on interval data. The CV divides by the mean, which is only meaningful with a true zero. Fix: use the standard deviation or range instead.
- Confusing the level of measurement with the measurement unit. Changing units from seconds to milliseconds does not change the level. Fix: identify the structure, not the label.
Limitations
The four-level framework cannot tell you whether your measurement instrument is any good. A variable can be perfectly ratio-scaled and still be measured with bias, and the level of measurement will not reveal that. It also cannot decide your analysis for you. Two researchers can look at the same satisfaction score and disagree about whether treating it as interval is acceptable, and the framework does not settle that argument.
The levels also blur at the edges. Counts look like ratio data, but fractional counts are often meaningless, and the scale is not arbitrary in the way a true ratio scale is [3]. Probabilities and angles fit extended categories better than the original four [3]. Use the framework as a starting point, then reason about your specific variable.
Frequently Asked Questions
What is the difference between interval and ratio?
Interval data has equal spacing but no true zero, so ratios of values are meaningless. Ratio data has equal spacing plus a true zero, so ratios are meaningful. Temperature in Celsius is interval. Weight, height, and reaction time are ratio.
Can I use the mean on ordinal data?
Technically you can compute it, but it may not mean what you think. The mean assumes equal distances between adjacent categories, and ordinal scales do not guarantee that. The median and interquartile range are safer summaries for ordinal data [1].
Is Likert scale data ordinal or interval?
A single Likert item is usually treated as ordinal. A sum or average of several Likert items is often treated as interval in practice, because the composite behaves more like a continuous score. The choice depends on your field and your analysis.
What statistics are valid for nominal data?
Counts, proportions, percentages, and the mode. You can also use chi-square tests on frequencies. You cannot compute a mean, median, or standard deviation in any meaningful way.
Does the level of measurement change if I change units?
No. Converting seconds to milliseconds or Celsius to Fahrenheit does not change the level. Unit changes are linear transformations, and they preserve the structure of the scale. Only a change in what the zero means, such as moving from Celsius to Kelvin, changes the level.
References
Further Reading
- NIST/SEMATECH e-Handbook of Statistical Methods
- OpenStax. Introductory Statistics 2e
- Krzywinski M, Altman N (2013). Importance of being uncertain. Nature Methods
Related Articles
- Types of Data: Nominal, Ordinal, Interval, Ratio
- Nominal vs Ordinal Variables: Differences and Examples
- What Is an Ordinal Scale? Definition and Examples
- What Is Ordinal Data? Definition and Examples
- Interval Data: Definition, Examples and When to Use It
- Statistical Synonyms: A Guide to Terminology in Statistics
- Measurement Bias in Research: Sources, Types, and Prevention
- Statistical Symbols and Notation: A Quick Reference