Ordinal Survey Questions: Examples and How to Write Them
By Dr. Zubair Khalid, DVM, MS, PhD ·
A good example of ordinal survey questions is "How satisfied are you with our service?" with answer choices from Very dissatisfied to Very satisfied. The responses have a clear order, but the distance between neighboring choices is not guaranteed to be equal. This article shows several examples of ordinal survey questions, explains how to write them, and walks through the analysis of real responses.
Quick Answer
- Ordinal survey questions ask respondents to rate or rank items along a defined order, such as Strongly disagree to Strongly agree.
- The answer choices are ordered, but the gaps between them are not assumed to be equal, which separates ordinal from interval questions.
- Common formats include Likert scales, frequency scales, satisfaction scales, and rank-order items.
- You analyze ordinal data with medians, modes, and frequency counts, plus tests that respect the ordering, such as the linear-by-linear test [1].
- Ordinal statistics are often preferred because conclusions stay the same under monotonic transformations of the variable [2].
What Ordinal Survey Questions Mean
In plain terms, an ordinal survey question is one where the answer options have a natural sequence. "Never, Sometimes, Often, Always" is ordered. "Red, Blue, Green" is not.
The precise statistical definition: an ordinal variable is a categorical variable whose categories have a meaningful rank order, but the intervals between adjacent categories are not assumed to be equal in size. This places ordinal data between nominal data, which has no order, and interval data, which has equal spacing. If you want the broader picture, see what ordinal data is and how it fits into the levels of measurement.
How It Works
Ordinal questions work by mapping a subjective judgment onto a small set of ordered labels. The mechanism has three parts.
First, the stem states what is being judged, such as satisfaction, agreement, or frequency. Second, the response scale supplies ordered labels. Third, you assign numeric codes to those labels for analysis, usually 1 through 5 or 1 through 7.
The key assumption is monotonicity. If you code "Very dissatisfied" as 1 and "Very satisfied" as 5, any higher code means more satisfaction. You can transform the codes with any strictly increasing function and the ranking of responses stays the same. That property is why ordinal methods are described as unaffected by monotonic transformation [2].
For central tendency, the median is the natural summary:
$$\text{Median position} = \frac{n+1}{2}$$
where $n$ is the number of valid responses. For an even $n$, the median is the average of the two middle sorted values. The mode is the most frequent category, and the mean is reported only as a convenience because it treats the gaps as equal.
Worked Example
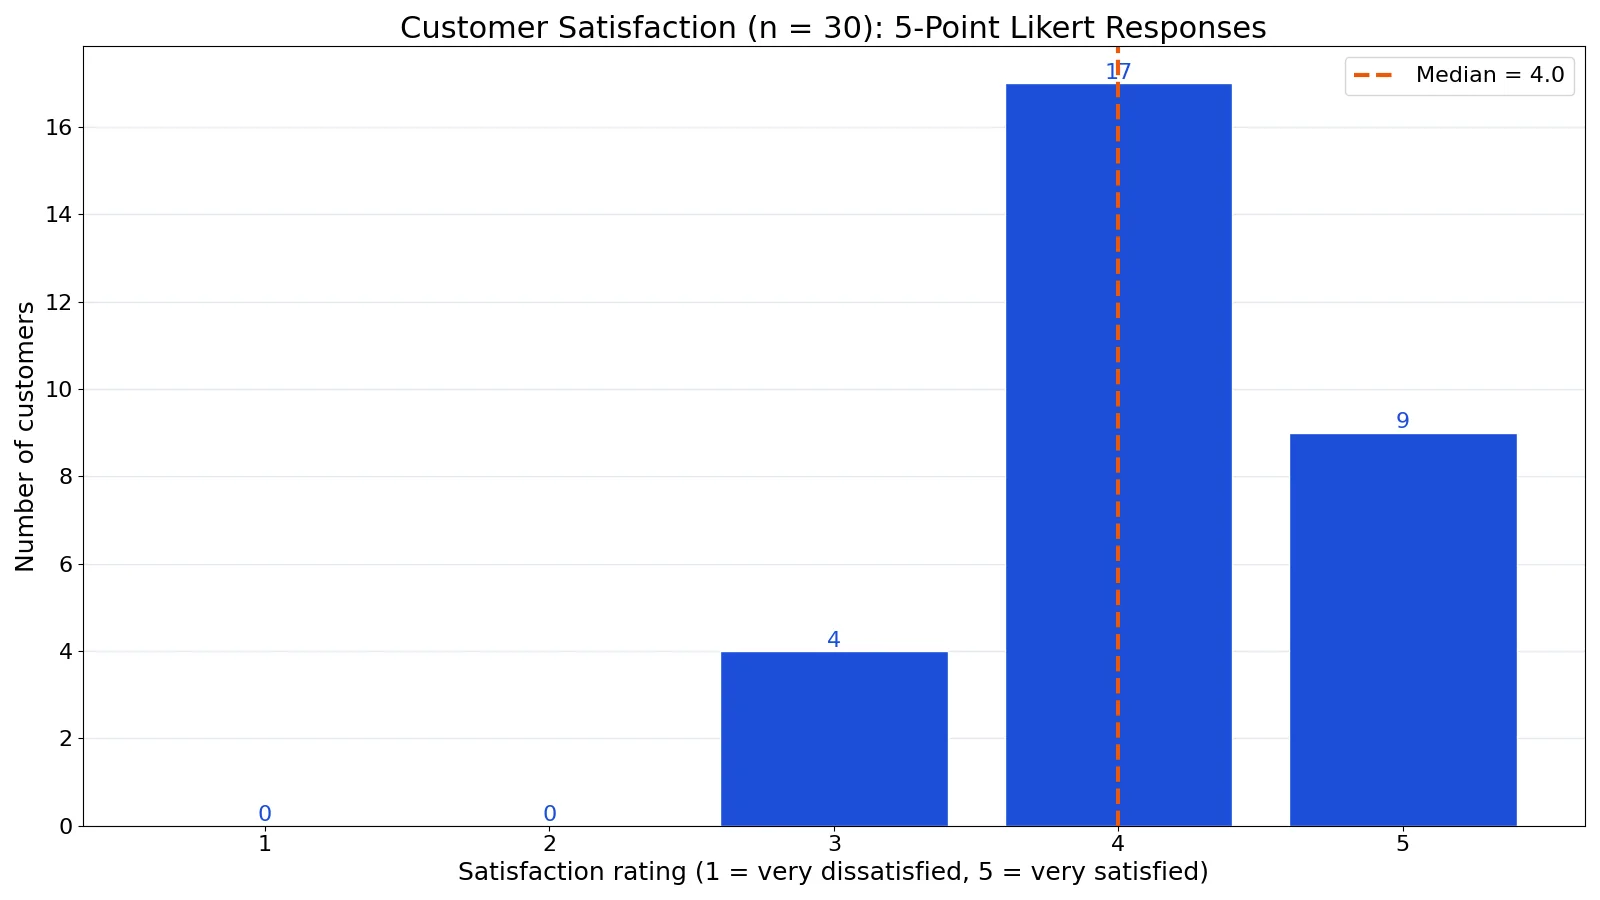
A company collects 30 customer satisfaction responses on a 5-point Likert scale, where 1 is very dissatisfied and 5 is very satisfied. The raw data are below.
| customer_id | satisfaction |
|---|---|
| 1 | 5 |
| 2 | 4 |
| 3 | 4 |
| 4 | 5 |
| 5 | 3 |
| 6 | 4 |
| 7 | 5 |
| 8 | 4 |
| 9 | 4 |
| 10 | 3 |
| 11 | 5 |
| 12 | 4 |
| 13 | 4 |
| 14 | 5 |
| 15 | 4 |
| 16 | 3 |
| 17 | 4 |
| 18 | 5 |
| 19 | 4 |
| 20 | 4 |
| 21 | 5 |
| 22 | 4 |
| 23 | 3 |
| 24 | 4 |
| 25 | 5 |
| 26 | 4 |
| 27 | 4 |
| 28 | 5 |
| 29 | 4 |
| 30 | 4 |
Step 1. Count the sample size. There are 30 responses, so $n = 30$.
Step 2. Build the frequency table. Category 1 has 0 responses, category 2 has 0, category 3 has 4, category 4 has 17, and category 5 has 9.
Step 3. Build cumulative counts. They are 0, 0, 4, 21, and 30 across categories 1 through 5.
Step 4. Find the median position. With $(n+1)/2 = (30+1)/2 = 15.5$, the median sits between the 15th and 16th sorted values.
Step 5. Read the sorted values. Position 15 is 4 and position 16 is 4, so the median is $(4 + 4) / 2 = 4.0000$.
Step 6. Compute the mean as a convenience statistic. The sum of responses is 125, so $125/30 = 4.1667$.
Step 7. Find the mode. Category 4 appears 17 times, so the mode is 4.
Step 8. Compute the share who chose 4 or 5. That is $(17 + 9)/30 = 86.6667$ percent.
Here is the code that produced these values.
import statistics
responses = [5,4,4,5,3,4,5,4,4,3,5,4,4,5,4,3,4,5,4,4,5,4,3,4,5,4,4,5,4,4]
median = statistics.median(responses)  # median = 4.0000
from collections import Counter
freq = Counter(responses)  # Counter({4: 17, 5: 9, 3: 4}), categories 1 and 2 are absent
Summary of the results (the mean and mode come from statistics.mean and statistics.mode, which the snippet does not call):
median = 4.0000, mean = 4.1667, mode = 4, freq = {1: 0, 2: 0, 3: 4, 4: 17, 5: 9}How to Interpret It
The median of 4.0 tells you the typical customer landed on "satisfied." The mode of 4 confirms that "satisfied" is the single most common answer. The mean of 4.1667 is slightly higher than the median because nine customers chose the top category, which pulls the average up.
The cumulative view is often the most useful. With 86.6667 percent of responses at 4 or 5, the picture is strongly positive. No one chose 1 or 2, so there is no visible dissatisfaction tail in this sample.
Report the median and mode as your primary summaries. Report the mean only alongside a note that it treats the scale as equally spaced. For a fuller comparison of scale types, see interval scale questions.
When to Use It (and when not to)
Use ordinal questions when you want to capture intensity or preference along a defined order and you do not need to claim that the gaps are equal. Satisfaction surveys, agreement batteries, frequency-of-behavior items, and rank-order questions all fit.
Do not use an ordinal scale when you need arithmetic on the responses. If you plan to compute average revenue, average time, or average count, use a numeric question instead. Do not use an ordinal scale when the categories have no natural order, such as brand names or departments. Those are nominal.
A practical middle path: if you want to treat the scale as numeric, use a labeled 1-to-5 or 1-to-7 scale and state that assumption openly in your methods.
Ordinal vs Interval Questions
The closest related idea is the interval question, where the distance between adjacent points is treated as equal.
| Feature | Ordinal question | Interval question |
|---|---|---|
| Order of categories | Yes | Yes |
| Equal gaps assumed | No | Yes |
| Typical example | Very dissatisfied to Very satisfied | Temperature in degrees, 0 to 100 rating slider |
| Best central tendency | Median, mode | Mean, standard deviation |
| Arithmetic on values | Limited | Meaningful |
For a deeper side-by-side, see nominal vs ordinal variables and what an ordinal scale is.
Common Mistakes
- Using an even number of options by accident. A 4-point scale forces a side and can frustrate respondents. Fix: decide deliberately whether you want a neutral midpoint, and label it clearly if you include one.
- Leaving labels off the middle points. A scale of 1 to 5 with only the endpoints labeled invites inconsistent interpretation. Fix: label every point.
- Treating the mean as the headline number. Averaging ordinal codes assumes equal gaps. Fix: lead with the median and mode, and report the mean as secondary.
- Mixing directions across items. If some items run positive-to-negative and others negative-to-positive, respondents misread them. Fix: keep the direction consistent within a block.
- Dropping "don't know" responses silently. Removing them changes your denominator. Fix: report how many were excluded and why.
- Using a chi-square test when an ordinal test fits. Standard categorical tests ignore the ordering and lose power. Fix: use a test designed for ordinal data, such as the linear-by-linear test [1].
Limitations
Ordinal scales cannot tell you how much more satisfied one person is than another. A respondent who picks 5 is not necessarily one unit happier than a respondent who picks 4. Any statement about magnitude is an assumption you are adding, not a property of the data.
Ordinal methods also have requirements. The linear-by-linear test needs both variables to be ordinal, expected cell counts of at least five, and independent observations [1]. Small samples with sparse categories will not meet those conditions, and you may need to collapse categories or switch to exact tests. Ordinal statistics are generally more robust when used appropriately, but that does not remove the need to check assumptions [2].
Frequently Asked Questions
What is an example of ordinal survey questions in a real study?
A course evaluation that asks "Rate your satisfaction with this course" on a scale from Very dissatisfied to Very satisfied is a standard example. So is "How often do you exercise?" with Never, Rarely, Sometimes, Often, Always. Both have ordered categories without equal spacing.
How many response options should an ordinal scale have?
Five or seven labeled points is the common range. Five keeps the cognitive load low for phone and mobile surveys. Seven gives more granularity when you expect a wide spread of opinions. Fewer than four points tends to lose too much detail.
Can I calculate a mean from ordinal survey data?
You can compute it, and many analysts do. The result assumes the gaps between categories are equal, which ordinal scales do not guarantee. Report the median and mode as your primary summaries and treat the mean as a rough convenience figure.
What is the difference between an ordinal question and a Likert question?
A Likert item is one common type of ordinal question. It uses an agreement scale such as Strongly disagree to Strongly agree. Ordinal is the broader category, covering satisfaction, frequency, and rank-order formats as well.
How do I analyze ordinal survey questions?
Start with a frequency table, then report the median and mode. For relationships between two ordinal variables, use a test that accounts for the ordering, such as the linear-by-linear test, which is more powerful than a chi-square test on the same data [1]. Ordinal methods also keep your conclusions stable under monotonic transformations [2].
References
- Analyzing Ordinal (Ranked) Data - Survey Design Basics - Library Guides at Penn State University
- ERIC - EJ536931 - Answering Ordinal Questions with Ordinal Data Using Ordinal Statistics., Multivariate Behavioral Research, 1996
Further Reading
- Krzywinski M, Altman N (2013). Importance of being uncertain. Nature Methods
- NIST/SEMATECH e-Handbook of Statistical Methods
- Ioannidis JPA (2005). Why Most Published Research Findings Are False. PLoS Medicine
- OpenStax. Introductory Statistics 2e
Related Articles
- Interval Scale Questions: Examples and How to Use Them
- What Is Ordinal Data? Definition and Examples
- Levels of Measurement: Nominal, Ordinal, Interval and Ratio
- Nominal vs Ordinal Variables: Differences and Examples
- What Is an Ordinal Scale? Definition and Examples
- Statistical Questions Examples: How to Write Them
- Designing Effective Qualitative Surveys: Question Types and Examples
- Statistical Questions: How to Identify and Formulate Them