What Is a Stratum? Definition and Examples in Statistics
By Dr. Zubair Khalid, DVM, MS, PhD ·
A stratum definition in statistics is simple: a stratum is a subgroup of a population whose members share one or more defining characteristics, such as age group, grade level, region, or income band. Researchers split a population into strata before sampling so that each subgroup is represented in the final sample. This article explains the meaning of stratum, shows how stratified sampling works, and walks through a worked example with real numbers.
Quick Answer
- A stratum is one subgroup inside a larger population, formed by a shared trait like grade level, region, or age band.
- The plural of stratum is strata. "Stratal" is the adjective form, as in "stratal boundaries."
- Strata must be mutually exclusive and collectively exhaustive, so every population element belongs to exactly one stratum [1].
- Stratified sampling draws an independent sample from each stratum, often in proportion to its size [1].
- The stratum definition matters because grouping before sampling can reduce variance and guarantee coverage of every subgroup.
What a Stratum Means
In plain language, a stratum is a slice of a population. If you survey students, you might slice them by grade level. If you monitor streams, you might slice them by elevation band. Each slice is a stratum, and the full set of slices covers the whole population.
The precise statistical definition is narrower. A stratum is a subset of the target population such that the subsets are mutually exclusive (no element appears in two strata) and collectively exhaustive (no element is left out) [1]. Stratification is the process of grouping members of the population into these subgroups before sampling [1]. Once the strata exist, you select an independent sample within each one, and you can allocate sample size equally across strata or in proportion to stratum size [1].
The word itself comes from Latin and originally meant a layer, as in rock layers. That image is useful. Strata stack on top of each other, they do not overlap, and together they form the whole formation. The same logic applies to a population in statistics, where the strata partition the full group.
How It Works
Stratified sampling has two moving parts: how you divide the population, and how you combine the results.
Step 1: Define the strata. Choose a variable that relates to what you are measuring. Grade level, region, sex, and age band are common choices. The strata must not overlap and must cover everyone [1].
Step 2: Sample within each stratum. Draw an independent sample from each stratum. You can allocate the sample equally, or proportionally to stratum size [1].
Step 3: Compute the stratified mean. Weight each stratum mean by its share of the population:
$$\bar{y}_{st} = \sum_{h=1}^{H} w_h \bar{y}_h$$
Here $H$ is the number of strata, $\bar{y}_h$ is the mean of stratum $h$, and $w_h$ is the stratum weight, usually $N_h / N$, the stratum's share of the population.
Step 4: Estimate the standard error. With proportional allocation and simple random sampling within strata, the estimated variance of the stratified mean is:
$$\widehat{\text{Var}}(\bar{y}_{st}) = \frac{s_w^2}{n}$$
where $s_w^2$ is the pooled within-stratum variance and $n$ is the total sample size. The standard error is the square root of that value.
The key idea is that the stratified mean only uses variation within strata. Differences between strata are removed from the sampling error, which is why stratification often produces a more precise estimate than a simple random sample of the same size.
Worked Example
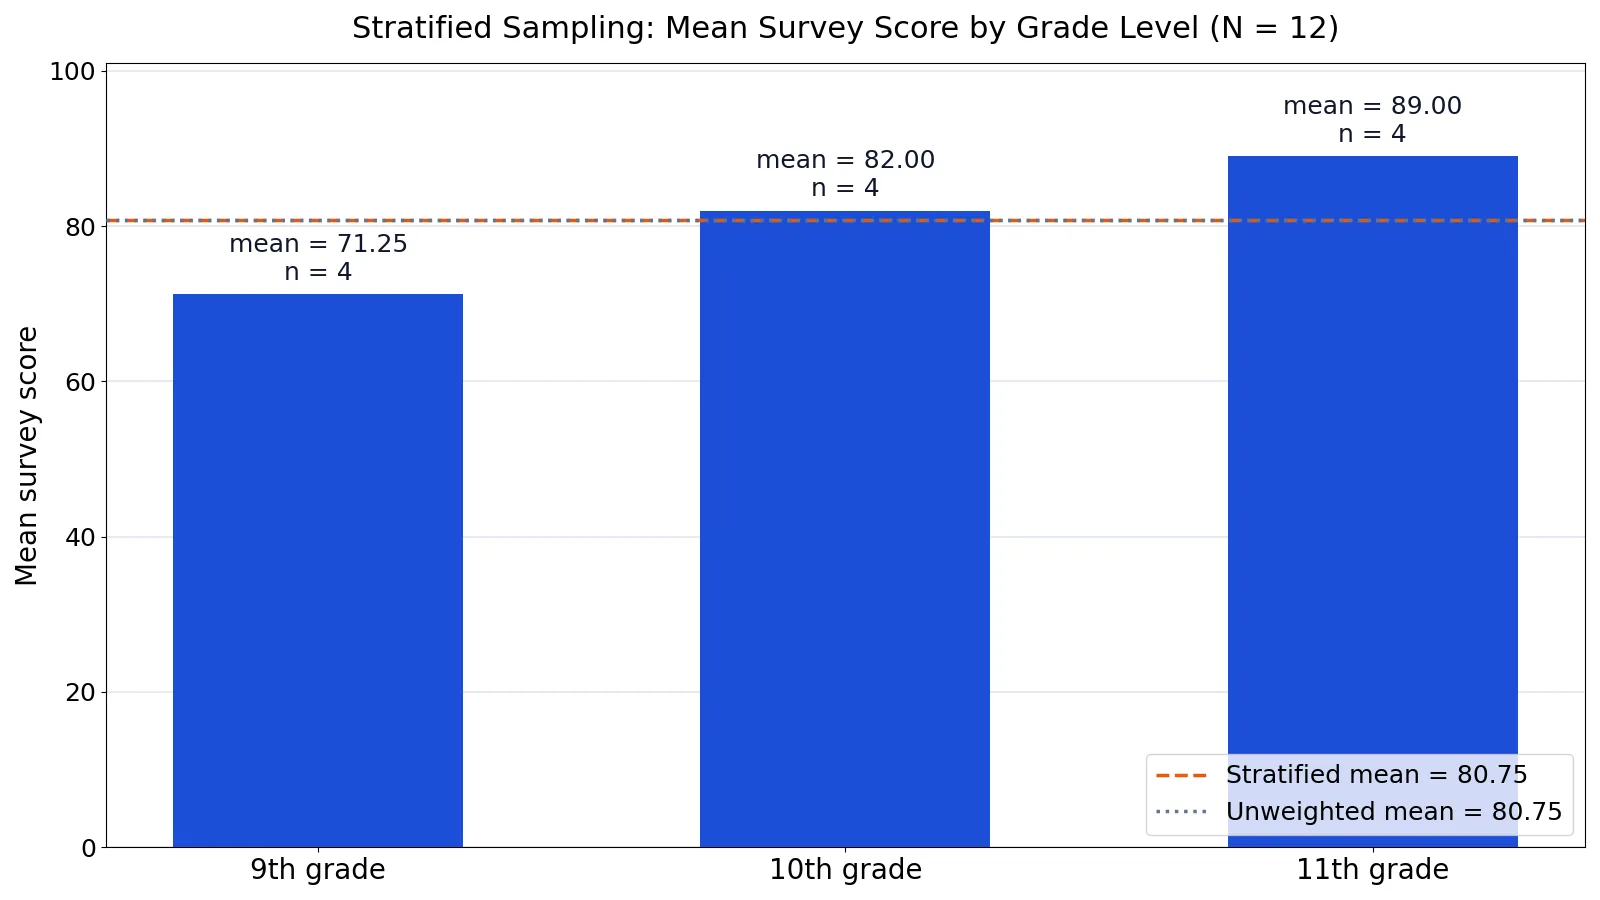
The dataset below shows survey scores for 12 sampled students across three grade-level strata: 9th, 10th, and 11th grade.
| grade_level | survey_score |
|---|---|
| 9th | 72 |
| 9th | 68 |
| 9th | 75 |
| 9th | 70 |
| 10th | 81 |
| 10th | 85 |
| 10th | 79 |
| 10th | 83 |
| 11th | 88 |
| 11th | 92 |
| 11th | 90 |
| 11th | 86 |
Step 1: Compute each stratum mean.
- Stratum 9th: n = 4, mean = 71.2500
- Stratum 10th: n = 4, mean = 82.0000
- Stratum 11th: n = 4, mean = 89.0000
Step 2: Compute the stratum weights. Each stratum holds 4 of the 12 students, so proportional allocation gives:
$$w_{9th} = 4/12 = 0.3333, \quad w_{10th} = 4/12 = 0.3333, \quad w_{11th} = 4/12 = 0.3333$$
Step 3: Compute the weighted stratified mean.
$$0.3333 \times 71.2500 + 0.3333 \times 82.0000 + 0.3333 \times 89.0000 = 80.7500$$
Step 4: Compare with the unweighted overall mean. The mean of all 12 scores is also 80.7500. With equal weights, the two agree. If the strata had different sizes, the weighted and unweighted values would diverge.
Step 5: Decompose the variance.
- Within-stratum variance (pooled, n-1): 66.7500 / 9 = 7.4167
- Between-stratum variance: 0.3333 × (71.2500 - 80.7500)² + 0.3333 × (82.0000 - 80.7500)² + 0.3333 × (89.0000 - 80.7500)² = 53.2917
- Sum of the two components: 60.7083 (this mixes an n-1 within part with a population-weighted between part, so it is an approximate total)
Step 6: Compute the standard error of the stratified mean.
$$\text{SE} = \sqrt{7.4167 / 12} = 0.7862$$
Here is the same calculation in Python:
import pandas as pd
df = pd.DataFrame({'grade_level': [...], 'survey_score': [...]})
means = df.groupby('grade_level')['survey_score'].mean()
sizes = df.groupby('grade_level')['survey_score'].size()
strat_mean = (means * sizes / sizes.sum()).sum()
print(round(strat_mean, 4))
Output:
80.75Notice how much of the combined variance (53.2917 of 60.7083) sits between strata. That is the portion stratification removes from the sampling error, which is why the standard error is small relative to the spread of the raw scores.
How to Interpret It
A stratum mean tells you how that subgroup behaves on its own. The 9th-grade mean of 71.25 and the 11th-grade mean of 89.00 are far apart, which confirms that grade level is a useful stratifying variable for this survey.
The stratified mean of 80.75 is the population-level estimate. It is a weighted average, so a stratum with more people pulls the estimate harder. When weights are equal, as in this example, the stratified mean equals the simple average.
The standard error of 0.7862 describes how much the stratified mean would vary across repeated samples of this design. Smaller standard errors mean more precise estimates. Because stratification removes between-stratum variance from the error term, a well-chosen stratifying variable usually shrinks the standard error compared with simple random sampling.
When you report results, report the stratum means alongside the overall estimate. A single number hides the structure that made the estimate precise. This is the same principle behind reporting a median next to a mean, since both describe center but respond differently to spread.
When to Use It (and when not to)
Use stratification when the population has clear subgroups that differ on the outcome you are measuring. Grade level, region, and age band are typical examples. It also helps when you need guaranteed coverage of small subgroups, since an independent sample within each stratum prevents a small group from being missed entirely [1].
Use it when you want to compare subgroups directly. Stratified sampling gives you a usable sample size in every stratum, which supports subgroup estimates.
Do not use it when the subgroups are hard to define or overlap. Strata must be mutually exclusive and collectively exhaustive [1]. If some elements fit two groups or none, the design breaks.
Do not use it when the stratifying variable has no relationship to the outcome. If grade level did not predict survey scores, splitting on it would add complexity without reducing variance. Also avoid it when a sampling frame with stratum labels is unavailable, since you cannot assign elements to strata you cannot identify.
Stratum vs Cluster
Strata and clusters are both groupings, but they serve opposite purposes. In stratified sampling you sample within every group. In cluster sampling you sample whole groups and often measure everyone inside the chosen ones.
| Feature | Stratum | Cluster |
|---|---|---|
| What it is | A subgroup sharing a trait | A naturally occurring group |
| Sampling approach | Sample within every group | Sample a subset of groups |
| Goal | Reduce variance, ensure coverage | Reduce cost and travel |
| Internal similarity | Members are similar to each other | Ideally as varied as the whole population |
| Between-group variation | Expected and used | Treated as a source of error |
The practical difference is coverage. Stratified sampling touches every stratum. Cluster sampling touches only the selected clusters, which is cheaper but less precise per unit of sample size.
Common Mistakes
- Confusing strata with clusters. Strata require a sample from every group, clusters do not. Fix: check whether your design samples within all groups or only some.
- Overlapping strata. If a student can be both "9th grade" and "10th grade," the strata are not mutually exclusive [1]. Fix: define categories with clear, non-overlapping boundaries.
- Leaving gaps in coverage. Strata must be collectively exhaustive so no element is excluded [1]. Fix: add an "other" or "unknown" stratum if needed.
- Ignoring unequal weights. Averaging stratum means without weighting gives the wrong estimate when stratum sizes differ. Fix: weight each mean by $N_h / N$.
- Stratifying on an irrelevant variable. A stratifying variable that does not relate to the outcome adds work without improving precision. Fix: check the between-stratum variance before committing.
- Reporting only the overall mean. The overall estimate hides subgroup differences. Fix: report stratum means and sizes alongside it.
Limitations
Stratified sampling cannot fix a biased sampling frame. If the list of population members is incomplete or outdated, every stratum inherits that flaw. It also cannot help when the stratifying variable is unknown for some elements, since those elements cannot be assigned to a group.
The precision gain depends entirely on the choice of stratifying variable. If between-stratum variance is small, the standard error barely improves over simple random sampling, and the extra design work is wasted. Stratification also requires you to know stratum sizes in advance if you want proportional allocation, which is not always possible. Finally, a stratified design complicates analysis. You need stratum weights and a variance formula that respects the design, and ignoring those details can produce standard errors that are too small.
Frequently Asked Questions
What is the plural of stratum?
The plural is strata. One subgroup is a stratum, and several subgroups are strata. The adjective form is stratal, which describes something relating to a stratum or strata.
What does stratum mean in sampling?
In sampling, a stratum is a subgroup of the population from which an independent sample is drawn [1]. The full set of strata partitions the population, and results from each stratum are combined using weights to produce an overall estimate.
What is the difference between stratified and simple random sampling?
Simple random sampling draws one sample from the whole population. Stratified sampling first divides the population into strata, then draws an independent sample from each one [1]. Stratification can reduce the standard error when the strata differ on the outcome.
Do strata have to be the same size?
No. Strata can be any size. What matters is that they are mutually exclusive and collectively exhaustive [1]. When sizes differ, you weight each stratum mean by its share of the population.
Can I use more than one variable to define strata?
Yes. You can cross two or more variables to form strata, such as grade level crossed with region. Each combination becomes its own stratum. More variables mean more strata, which can make some strata very small, so watch your sample size per group.
References
Further Reading
- NIST/SEMATECH e-Handbook of Statistical Methods
- OpenStax. Introductory Statistics 2e
- Krzywinski M, Altman N (2013). Importance of being uncertain. Nature Methods
- Krzywinski M, Altman N (2013). Significance, P values and t-tests. Nature Methods
- Wasserstein RL, Lazar NA (2016). The ASA Statement on p -Values: Context, Process, and Purpose. The American Statistician