What Is Ordinal Data? Definition and Examples
By Dr. Zubair Khalid, DVM, MS, PhD ·
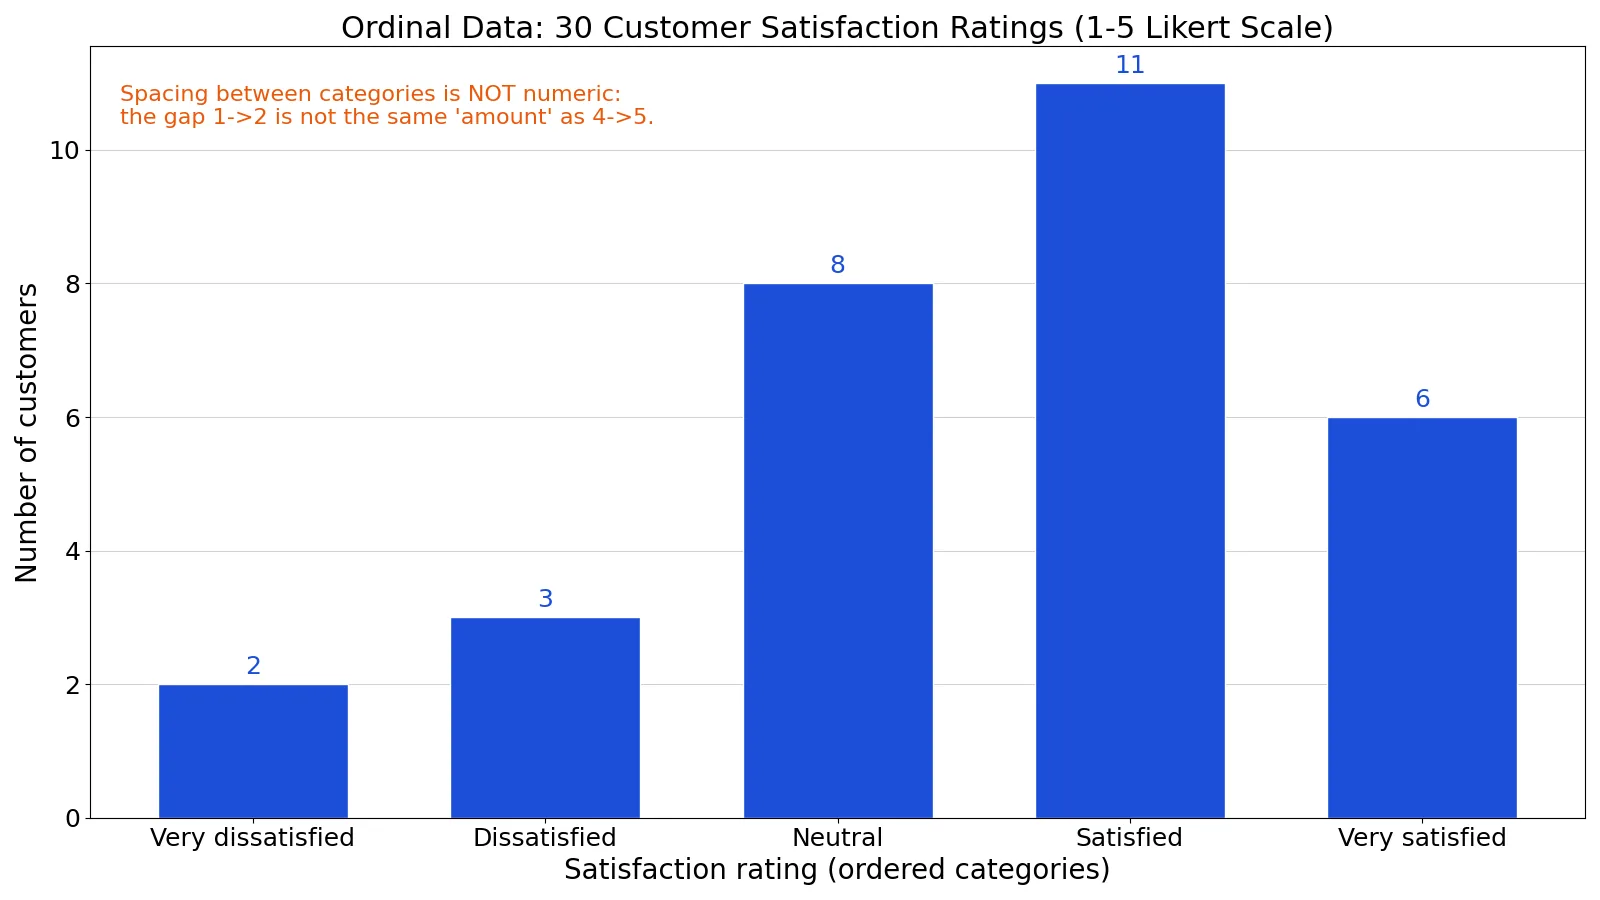
Ordinal data is a categorical data type whose categories have a natural order, but the distances between those categories are not known. A 1 to 5 satisfaction rating is the classic case: you can rank responses from "Very dissatisfied" to "Very satisfied," but you cannot say the gap between 1 and 2 equals the gap between 4 and 5. This article defines ordinal data, contrasts it with nominal and interval data, and walks through a real summary of 30 survey responses.
Quick Answer
- Ordinal data has ordered categories, so you can rank and sort values, but the spacing between categories is not defined [1].
- It is one of four levels of measurement described by S. S. Stevens in 1946, alongside nominal, interval and ratio [1].
- The median and mode are valid summaries. The mean is usually not meaningful because the numeric codes are labels, not measurements [2].
- Likert-scale items are the most common example, and they are treated as ordinal when you cannot confirm equal intervals between response options [2].
- Ordinal data sits between nominal data (no order) and interval data (equal, meaningful intervals) [3].
What Ordinal Data Means
In plain terms, ordinal data is information you can put in order but cannot measure precisely. If you can say "this is higher than that" but not "this is exactly twice that," you are working with ordinal data.
The precise statistical definition: ordinal data is a categorical data type where the variables have natural, ordered categories and the distances between the categories are not known [1]. The categories exist on an ordinal scale, which is distinguished from a nominal scale by having a ranking [1]. It differs from interval and ratio scales because its category widths do not represent equal increments of the underlying attribute [1].
That last point is the whole story. "Satisfied" ranks above "Neutral," but the psychological distance between them is not the same as the distance between "Neutral" and "Dissatisfied." The order is real. The spacing is not.
How It Works
Ordinal data works through ranking and counting, not arithmetic on the codes. The mechanism is straightforward.
For a variable with $k$ ordered categories, each observation falls into exactly one category. You record the count in each category:
$$f_j = \frac{n_j}{n}$$
where $n_j$ is the number of observations in category $j$, $n$ is the total sample size, and $f_j$ is the relative frequency of that category.
Because the categories are ordered, you can also compute cumulative frequencies:
$$F_j = \sum_{i=1}^{j} f_i$$
where $F_j$ is the proportion of observations at or below category $j$. This is where ordinal data earns its keep. Cumulative percentages tell you what share of respondents fell at or below a given level, which is a meaningful statement even when the spacing is unknown.
The center of an ordinal distribution is the median, the category that splits the ordered data in half. The mode, the most frequent category, is also valid. The mean is not, because it requires equal intervals to be interpretable [2].
Worked Example
A survey asked 30 customers to rate their satisfaction on a 1 to 5 Likert scale, where 1 is "Very dissatisfied" and 5 is "Very satisfied." The raw responses are:
| customer_id | satisfaction_rating |
|---|---|
| 1 | 1 |
| 2 | 1 |
| 3 | 2 |
| 4 | 2 |
| 5 | 2 |
| 6 | 3 |
| 7 | 3 |
| 8 | 3 |
| 9 | 3 |
| 10 | 3 |
| 11 | 3 |
| 12 | 3 |
| 13 | 3 |
| 14 | 4 |
| 15 | 4 |
| 16 | 4 |
| 17 | 4 |
| 18 | 4 |
| 19 | 4 |
| 20 | 4 |
| 21 | 4 |
| 22 | 4 |
| 23 | 4 |
| 24 | 4 |
| 25 | 5 |
| 26 | 5 |
| 27 | 5 |
| 28 | 5 |
| 29 | 5 |
| 30 | 5 |
Step 1. Sample size: $n = 30$.
Step 2. Count each rating and convert to a frequency.
| Rating | Label | Count | Frequency | Cumulative count | Cumulative percent |
|---|---|---|---|---|---|
| 1 | Very dissatisfied | 2 | 0.0667 | 2 | 6.67% |
| 2 | Dissatisfied | 3 | 0.1000 | 5 | 16.67% |
| 3 | Neutral | 8 | 0.2667 | 13 | 43.33% |
| 4 | Satisfied | 11 | 0.3667 | 24 | 80.00% |
| 5 | Very satisfied | 6 | 0.2000 | 30 | 100.00% |
Step 3. Find the center. The median is 4.0000 and the mode is 4, labeled "Satisfied." The cumulative percent column shows that 80.00% of customers rated 4 or below, and 43.33% rated 3 or below.
Step 4. Note what you should not do. If you treat the codes as interval values, the mean is 3.5333. That number is not meaningful for ordinal data, because the numeric gaps between adjacent codes are arbitrary. The gaps are all 1 in code space, but they do not represent equal increments of satisfaction.
Here is the same summary in Python:
import pandas as pd
ratings = [1,1,2,2,2,3,3,3,3,3,3,3,3,4,4,4,4,4,4,4,4,4,4,4,5,5,5,5,5,5]
s = pd.Series(ratings)
print('counts:', s.value_counts().sort_index().tolist())
print(f'median: {s.median():.4f}')
print('mode:', s.mode()[0], '(Satisfied)')
print(f'mean if interval: {s.mean():.4f}')
Output:
counts: [2, 3, 8, 11, 6]
median: 4.0000
mode: 4 (Satisfied)
mean if interval: 3.5333
In Excel, the same counts come from COUNTIF(A2:A31,1) through COUNTIF(A2:A31,5), giving 2, 3, 8, 11 and 6. MEDIAN returns 4 and MODE returns 4.
How to Interpret It
Read ordinal results as position, not magnitude. "The median rating is 4" means the typical customer landed in the "Satisfied" category. It does not mean satisfaction is 4 out of some continuous scale.
Use the cumulative percent column to make comparisons. Saying "80.00% of customers rated 4 or below" is a precise, defensible statement about an ordinal distribution. Saying "the average customer was 3.53 satisfied" is not.
When you compare two groups, compare their distributions or their medians, not their means. Tests designed for ordinal data include the Mann-Whitney test for two independent samples and the Wilcoxon signed ranks test for two related samples [1]. For more than two related samples, the Friedman test is appropriate [1]. For correlation between two ordinal variables, Kendall's tau and Spearman's rho are standard choices [1].
When to Use It (and when not to)
Use ordinal data when your categories have a clear rank but no measurable spacing. Satisfaction ratings, education levels, agreement scales, pain severity ratings and performance tiers all qualify. If you can order the responses but cannot defend equal gaps, ordinal is the honest label.
Do not use it when the categories have no order. Biological race and favorite color are nominal, not ordinal [3]. Do not use it when the intervals are genuinely equal and you can defend that claim. Temperature in Celsius and calendar years are interval data. Length, income and age are quantitative, and their units give precise meaning to differences along the scale [3].
A practical middle case: a five-point Likert scale with "strongly agree" through "strongly disagree." If you cannot be sure the intervals between the five values are equal, treat it as ordinal [2]. Many analysts do exactly that.
Ordinal Data vs Interval Data
Interval data has ordered categories with equal, meaningful intervals. Ordinal data has ordered categories with unknown intervals. That single difference changes which statistics are valid.
| Feature | Ordinal data | Interval data |
|---|---|---|
| Order | Yes | Yes |
| Equal intervals | No | Yes |
| Meaningful mean | Usually no | Yes |
| Valid center | Median, mode | Mean, median, mode |
| Example | Likert satisfaction rating | Temperature in Celsius |
| Typical tests | Mann-Whitney, Wilcoxon, Friedman [1] | t-test, ANOVA |
The distinction matters because it determines your analysis. Running a t-test on ordinal codes assumes equal intervals you cannot justify. Running a Mann-Whitney test respects the ranking without inventing spacing.
Common Mistakes
- Averaging Likert codes. Computing a mean of 3.5333 treats labels as measurements. Fix: report the median and mode, or the full frequency distribution.
- Treating ordinal as nominal. Ignoring the order throws away real information. Fix: use cumulative percentages and rank-based tests instead of plain category counts.
- Treating ordinal as interval. Assuming equal gaps leads to overstated precision. Fix: check whether you can defend equal intervals before using parametric tests.
- Assuming the numeric codes are the data. The numbers 1 to 5 are labels for categories. Fix: always report the category labels alongside the codes.
- Comparing means across groups. A higher mean does not prove a group is more satisfied when spacing is unknown. Fix: compare medians or full distributions.
- Dropping the middle category. Collapsing "Neutral" into an adjacent category changes the ranking structure. Fix: keep all categories unless you have a stated reason to combine them.
Limitations
Ordinal data cannot support arithmetic. You cannot add, subtract or average ordinal values and get a meaningful result, because the distances between categories are not known [1]. Any statistic that depends on those distances inherits that uncertainty.
Ordinal summaries also lose detail. A median of 4 hides whether responses clustered tightly around 4 or split between 1 and 5. Two groups can share a median and have very different distributions. Always pair the median with the frequency table or a bar chart so the shape of the distribution is visible.
Frequently Asked Questions
What is an example of ordinal data?
A 1 to 5 customer satisfaction rating is a standard example. So are education levels (high school, bachelor's, master's, doctorate), agreement scales (strongly disagree through strongly agree), and pain severity ratings. In each case the categories have a clear order but the gaps between them are not equal or measurable.
Is Likert scale data ordinal or interval?
It depends on what you can defend. A five-point Likert scale is ordinal when you cannot be sure the intervals between the five values are equal [2]. Many researchers treat single Likert items as ordinal and only treat summed multi-item scales as interval when they have evidence supporting equal spacing.
Can you calculate a mean for ordinal data?
Usually not. An average requires a variable to be numerical, and the spacing between ordinal categories is uneven, so the mean has questionable meaning [2]. Report the median and mode instead, along with the frequency distribution.
What is the difference between ordinal and nominal data?
Nominal data has categories with no intrinsic ordering, such as biological race [2][3]. Ordinal data has categories with a natural rank. The ordinal scale is distinguished from the nominal scale by having a ranking [1].
Which statistical tests work with ordinal data?
For two independent samples, use the Mann-Whitney test. For two related samples, use the sign test or the Wilcoxon signed ranks test. For more than two related samples, use the Friedman test. For correlation between two ordinal variables, use Kendall's tau or Spearman's rho [1].
References
- Ordinal data - Wikipedia
- What is the difference between categorical, ordinal and interval variables?
- Types of Data | Introduction to Data Science
Further Reading
- Wilson G, Bryan J, Cranston K et al. (2017). Good enough practices in scientific computing. PLOS Computational Biology
- Wilkinson MD, Dumontier M, Aalbersberg IJ et al. (2016). The FAIR Guiding Principles for scientific data management and stewardship. Scientific Data
- NIST/SEMATECH e-Handbook of Statistical Methods