How to Calculate Standard Error of the Mean (SEM)
By Dr. Zubair Khalid, DVM, MS, PhD ·
To calculate the standard error of the mean (SEM), divide the sample standard deviation $s$ by the square root of the sample size $n$. That is the whole method: find $s$, find $\sqrt{n}$, divide. This article shows how to calculate SEM by hand, in Python, and in a spreadsheet, using a small dataset of lab measurements.
Quick Answer
- Formula: $\text{SEM} = \dfrac{s}{\sqrt{n}}$, where $s$ is the sample standard deviation (with $n-1$ in the denominator) and $n$ is the sample size.
- What it measures: the typical distance between a sample mean and the true population mean. Smaller SEM means a more precise estimate.
- Step 1: compute the sample mean $\bar{x}$.
- Step 2: compute the sample standard deviation $s$.
- Step 3: divide $s$ by $\sqrt{n}$.
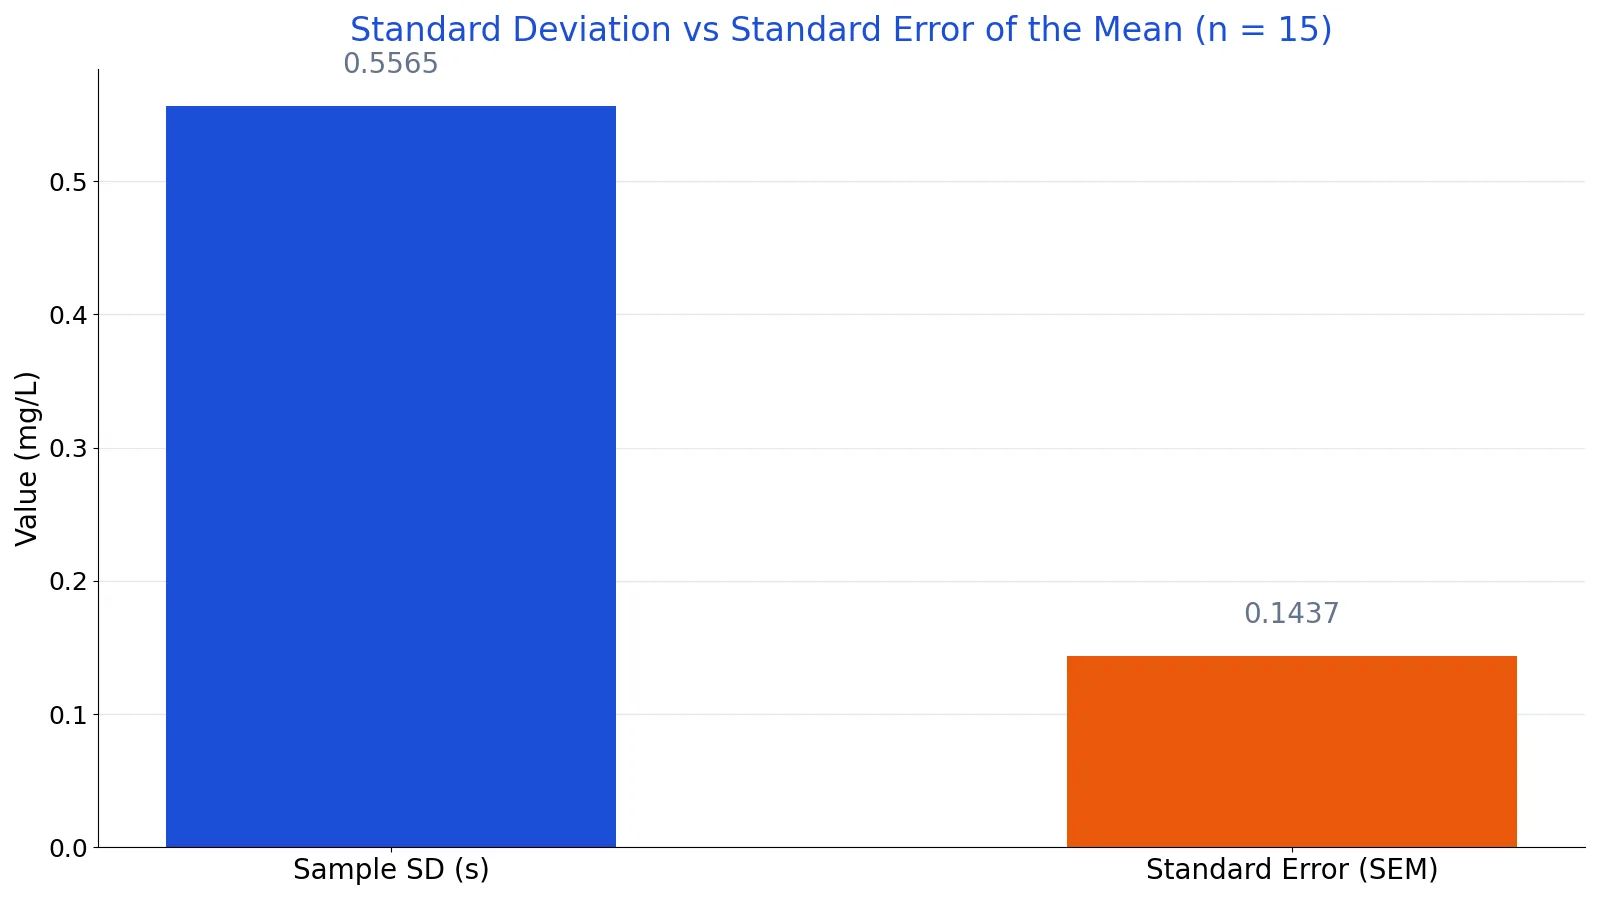
- Example result: for 15 measurements with $s = 0.5565$, $\text{SEM} = 0.5565 / 3.8730 = 0.1437$.
Before You Start
You need three things before you can calculate SEM.
First, a sample of numeric values. The data should be a random sample from the population you care about. If your sample is biased, the SEM will be small and precise but still wrong about the population.
Second, the sample standard deviation, not the population standard deviation. The sample version divides the sum of squared deviations by $n - 1$. The population version divides by $N$. For SEM from sample data, use the $n - 1$ version. This is the same distinction covered in how to calculate standard deviation.
Third, the sample size $n$. You need at least two observations for the standard deviation to exist. SciPy's sem function requires at least two observations in the input array [1].
One naming note. "SEM" almost always means standard error of the mean. SciPy's documentation also lists "standard error of measurement" as an alternate expansion of the same function name [1]. In most statistics work, and throughout this article, SEM means standard error of the mean.
The formula itself is simple, but it depends on the standard deviation being correct. If you want the formula written out on its own, see standard error of the mean: formula and example.
Step by Step
- Count your observations. Let $n$ be the number of values in the sample.
- Sum the values. Add every observation together.
- Compute the sample mean. Divide the sum by $n$: $$\bar{x} = \frac{\sum_{i=1}^{n} x_i}{n}$$
- Compute the sample variance. Subtract the mean from each value, square each difference, add the squares, and divide by $n - 1$: $$s^2 = \frac{\sum_{i=1}^{n}(x_i - \bar{x})^2}{n - 1}$$
- Take the square root of the variance. This gives the sample standard deviation $s$.
- Take the square root of $n$.
- Divide $s$ by $\sqrt{n}$. The result is the standard error of the mean: $$\text{SEM} = \frac{s}{\sqrt{n}}$$
Steps 1 through 5 are the standard mean and standard deviation workflow. If you want a refresher on the mean itself, see how to calculate the mean. The only new step is the final division.
Worked Example
The dataset is 15 lab measurements of concentration in mg/L.
| measurement_mg_per_L |
|---|
| 12.4 |
| 11.8 |
| 13.1 |
| 12.9 |
| 12.2 |
| 11.5 |
| 13.4 |
| 12.7 |
| 12.0 |
| 12.6 |
| 11.9 |
| 13.2 |
| 12.3 |
| 12.8 |
| 12.1 |
Walking through the steps:
| Step | Value |
|---|---|
| Sample size $n$ | $n = 15$ |
| Sum of values | $186.9000$ |
| Sample mean $\bar{x}$ | $186.9000 / 15 = 12.4600$ |
| Sample variance $s^2$ | $0.3097$ |
| Sample standard deviation $s$ | $\sqrt{0.3097} = 0.5565$ |
| Square root of $n$ | $\sqrt{15} = 3.8730$ |
| Standard error of the mean | $0.5565 / 3.8730 = 0.1437$ |
So the sample mean is 12.46 mg/L and the standard error of the mean is 0.1437 mg/L. In plain terms, the sample mean is 12.46 and a typical sample mean from this population would land roughly 0.14 mg/L away from the true mean.
The same calculation in Python:
import statistics, math
values = [12.4, 11.8, 13.1, 12.9, 12.2, 11.5, 13.4, 12.7, 12.0, 12.6, 11.9, 13.2, 12.3, 12.8, 12.1]
sd = statistics.stdev(values)   # sample SD (n-1)
sem = sd / math.sqrt(len(values))
Output:
SEM = 0.1437 (s = 0.5565, n = 15)Notice how much smaller the SEM is than the standard deviation. The standard deviation describes how spread out individual measurements are. The SEM describes how precise the mean is. With $n = 15$, the SEM is about a quarter of the SD. That gap widens as $n$ grows, because $\sqrt{n}$ grows while $s$ stays roughly stable.
Other Ways to Do It
SciPy. The scipy.stats.sem function computes the standard error directly from an array [1]. Its signature is scipy.stats.sem(a, axis=0, ddof=1, nan_policy='propagate', *, keepdims=False) [1]. The default ddof=1 matches the sample standard deviation convention used above. If you pass ddof=0, you get the population-style version. The axis argument controls which dimension is reduced, and axis=None ravels the whole array before computing [1]. The nan_policy argument controls what happens when missing values appear: propagate passes the NaN through, omit drops it, and raise throws an error [1].
Excel. You can compute SEM with a formula that combines STDEV.S and COUNT, or with STDEV.S(range)/SQRT(COUNT(range)). The full walkthrough is in how to calculate standard error of the mean in Excel. If you only need the standard deviation part, see how to calculate standard deviation in Excel.
Online calculators. If you just want the number, the standard deviation calculator gives you $s$, and you divide by $\sqrt{n}$ yourself. The mean, median and mode calculator handles the mean and count. Both are useful when you are checking hand work.
Troubleshooting
The SEM looks too small. Check whether you divided by $\sqrt{n}$ or by $n$. Dividing by $n$ gives a much smaller number and is wrong for SEM.
The SEM looks too large. Check that you divided the standard deviation by $\sqrt{n}$ at all, and that $n$ is the full sample size. Using the population standard deviation (dividing by $N$) cannot be the cause, because it makes the SEM slightly smaller, not larger.
You have missing values. Decide up front whether to drop them or impute them. SciPy's nan_policy='omit' drops NaN values before computing [1]. Dropping changes $n$, which changes the SEM.
Your software gives a different answer. Check the degrees of freedom setting. A ddof of 1 versus 0 changes the standard deviation and therefore the SEM [1].
You only have one observation. The standard deviation is undefined, so the SEM is undefined too. SciPy requires at least two observations [1].
Common Mistakes
- Dividing by $n$ instead of $\sqrt{n}$. The formula is $s / \sqrt{n}$. Dividing by $n$ produces a number that is too small and has no standard interpretation.
- Using the population standard deviation. For sample data, use $n - 1$ in the variance denominator. Using $N$ understates the variability and the SEM.
- Confusing SD and SEM in a report. The SD describes individual spread, the SEM describes precision of the mean. Labeling one as the other misleads readers about how precise your estimate is. Altman and Bland cover this distinction directly [2].
- Reporting SEM as a confidence interval. The SEM is a standard error, not a 95% interval. A rough 95% interval is about $\bar{x} \pm 2 \times \text{SEM}$ for large samples, but that is an approximation and depends on the sample size.
- Forgetting that SEM shrinks with $n$. Quadrupling your sample size roughly halves the SEM. If you compare SEMs across studies with different sample sizes, you are partly comparing sample sizes.
- Mixing up SEM and standard error of measurement. Both abbreviate to SEM. In psychometrics and testing contexts, SEM often means standard error of measurement, which is a different quantity [1].
Limitations
The SEM assumes your observations are independent and come from the same distribution. If your data are clustered, repeated measures on the same subject, or otherwise correlated, the formula $s / \sqrt{n}$ understates the true standard error. Time series data, nested designs, and paired measurements all need different standard error formulas.
The SEM also says nothing about bias. A large, carefully collected sample can have a tiny SEM and still be systematically off if the sampling frame is wrong. Precision and accuracy are separate properties. Finally, the SEM is a large-sample concept in its interpretation. With very small samples, the sampling distribution of the mean may not be well approximated by a normal curve, so intervals built from the SEM can be misleading. For sample size planning that uses variability estimates, see sample size standard deviation formula.
Frequently Asked Questions
How do you calculate SEM from standard deviation?
Divide the sample standard deviation by the square root of the sample size. If $s = 0.5565$ and $n = 15$, then $\text{SEM} = 0.5565 / 3.8730 = 0.1437$. You need the sample standard deviation, computed with $n - 1$ in the denominator, not the population version.
How to calculate SE when you only have the mean and n?
You cannot. The standard error depends on the variability in the data, so you need the standard deviation or the raw values. If a paper reports only the mean and sample size, the SEM is not recoverable from those two numbers alone.
Is SEM the same as standard deviation?
No. The standard deviation measures how spread out individual observations are. The SEM measures how precisely the sample mean estimates the population mean. The SEM is always smaller than the SD for any sample with $n > 1$, and it shrinks as the sample grows.
What is a good SEM value?
There is no universal threshold. A good SEM is small relative to the mean and relative to the effect size you care about. What matters is whether the precision is enough for your decision. Report the SEM alongside the mean so readers can judge.
Does SEM get smaller with larger samples?
Yes. The SEM is proportional to $1 / \sqrt{n}$. Going from 15 to 60 observations halves the SEM, assuming the standard deviation stays about the same. This is why larger samples give more precise estimates of the population mean.
References
Further Reading
- NIST/SEMATECH e-Handbook of Statistical Methods
- OpenStax. Introductory Statistics 2e
- Krzywinski M, Altman N (2013). Importance of being uncertain. Nature Methods
- Krzywinski M, Altman N (2013). Significance, P values and t-tests. Nature Methods
Related Articles
- How to Calculate Standard Error of the Mean in Excel
- Standard Error of the Mean: Formula and Example
- How to Calculate Standard Deviation: Formula and Steps
- How to Calculate the Mean: Formula and Step by Step Examples
- Mean of Interval: How to Find the Midpoint and Average
- Sample size standard deviation formula