Standard Error of the Mean: Formula and Example
By Dr. Zubair Khalid, DVM, MS, PhD ·
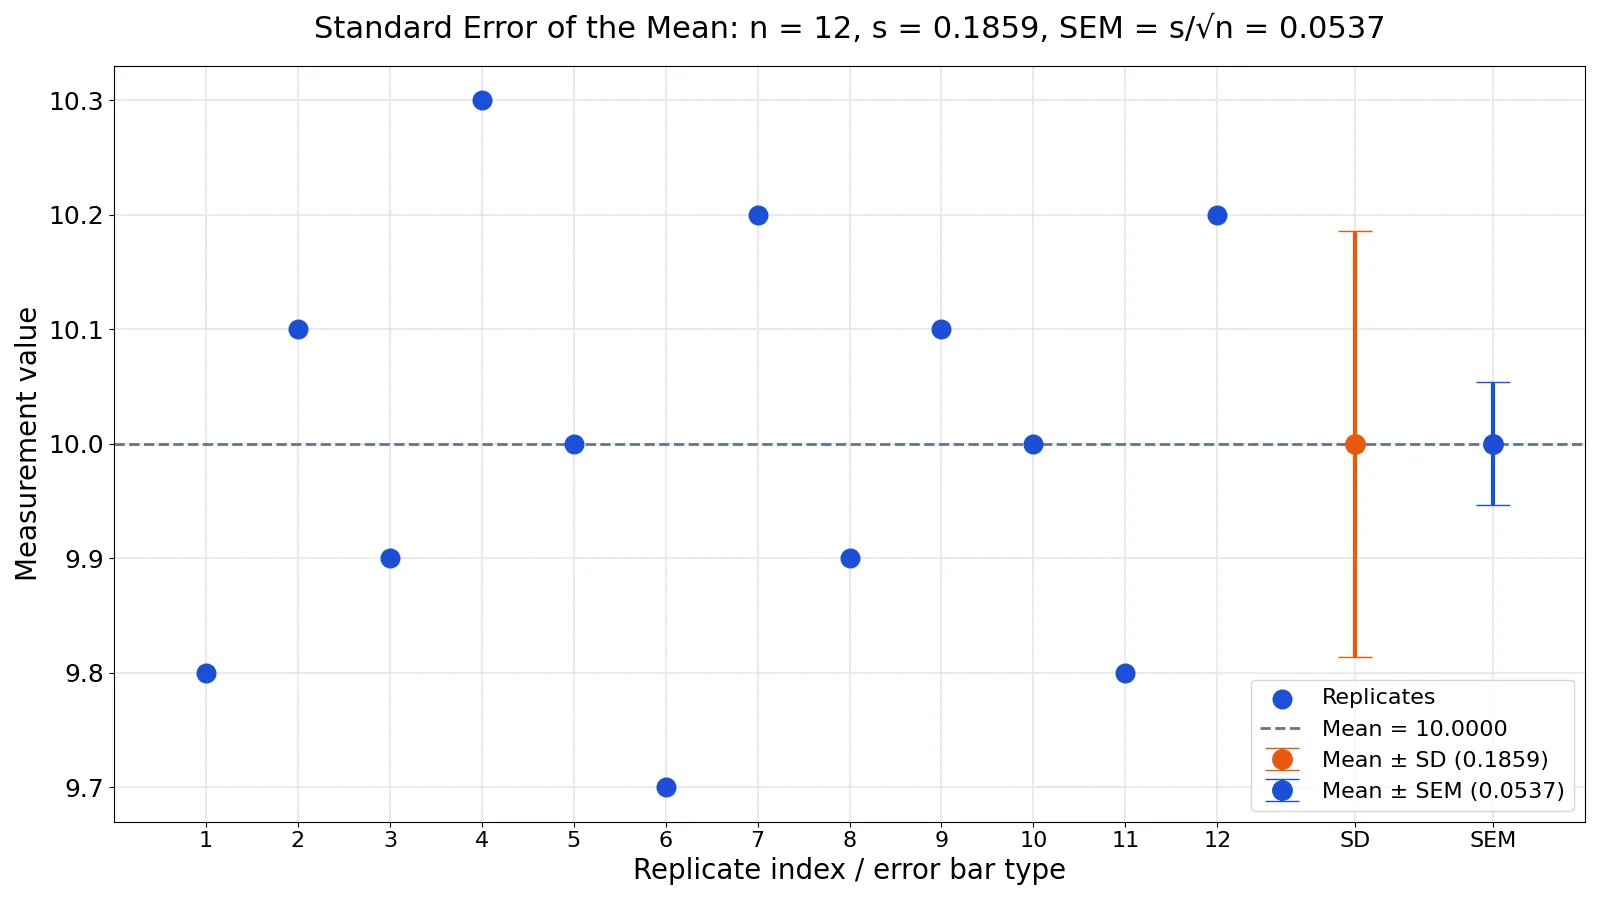
The standard error of the mean (often shortened to SE of mean) measures how precisely a sample mean estimates the true population mean. It is the standard deviation of the sampling distribution of the mean, so it tells you how much a sample mean would bounce around if you repeated the study many times. A smaller standard error means a more precise estimate.
Quick Answer
- The standard error of the mean is $SEM = s / \sqrt{n}$, where $s$ is the sample standard deviation and $n$ is the sample size.
- It measures the precision of an estimated population mean, not the spread of individual data values [1].
- It shrinks as the sample grows: quadrupling $n$ halves the standard error.
- In the worked example below, $s = 0.1859$ and $n = 12$, giving $SEM = 0.0537$.
- Report it as a precision measure, and prefer a confidence interval when you want to state a range for the population mean [1].
The Formula
The standard error of the mean is the sample standard deviation divided by the square root of the sample size:
$$SEM = \frac{s}{\sqrt{n}}$$
Each symbol means the following:
| Symbol | Meaning |
|---|---|
| $SEM$ | Standard error of the mean, the estimated standard deviation of $\bar{x}$ |
| $s$ | Sample standard deviation, computed with the $n-1$ denominator |
| $n$ | Number of observations in the sample |
| $\bar{x}$ | Sample mean |
| $\mu$ | True population mean, usually unknown |
The logic behind the formula is that averages are less variable than single measurements. If individual values have standard deviation $s$, then the mean of $n$ of them has standard deviation $s / \sqrt{n}$. That quantity is the standard error. You can see the same idea worked out from raw data in the guide to the sample mean, and the spread of individual values is covered in mean and standard deviation.
How to Calculate It Step by Step
- Collect your $n$ observations and record them in one column.
- Compute the sample mean $\bar{x}$ by summing the values and dividing by $n$.
- Subtract the mean from each value to get the deviations, then square each deviation.
- Sum the squared deviations and divide by $n - 1$ to get the sample variance $s^2$.
- Take the square root of the variance to get the sample standard deviation $s$.
- Divide $s$ by $\sqrt{n}$ to get the standard error of the mean.
Steps 2 through 5 are the ordinary sample standard deviation calculation. If you want a tool to handle them, the standard deviation calculator returns $s$ directly, and you finish with one division.
Worked Example
The dataset is 12 lab replicate measurements of a single sample, all measuring the same quantity.
| Replicate | Value |
|---|---|
| 1 | 9.8 |
| 2 | 10.1 |
| 3 | 9.9 |
| 4 | 10.3 |
| 5 | 10.0 |
| 6 | 9.7 |
| 7 | 10.2 |
| 8 | 9.9 |
| 9 | 10.1 |
| 10 | 10.0 |
| 11 | 9.8 |
| 12 | 10.2 |
Step 1. Count the observations. $n = 12$.
Step 2. Compute the sample mean. The values sum to 120.0, so
$$\bar{x} = \frac{120.0}{12} = 10.0000$$
Step 3. Sum the squared deviations. Each value minus 10.0000, squared, then added:
$$\sum (x_i - \bar{x})^2 = 0.3800$$
Step 4. Compute the sample variance. Divide by $n - 1 = 11$:
$$s^2 = \frac{0.3800}{11} = 0.0345$$
Step 5. Compute the sample standard deviation.
$$s = \sqrt{0.0345} = 0.1859$$
Step 6. Compute the standard error of the mean. Divide by the square root of the sample size:
$$SEM = \frac{0.1859}{\sqrt{12}} = \frac{0.1859}{3.4641} = 0.0537$$
The results in one table:
| Quantity | Value |
|---|---|
| $n$ | 12 |
| Mean $\bar{x}$ | 10.0000 |
| Variance $s^2$ | 0.0345 |
| Standard deviation $s$ | 0.1859 |
| $\sqrt{n}$ | 3.4641 |
| Standard error $SEM$ | 0.0537 |
| Ratio $s / SEM$ | 3.4641 |
The ratio $s / SEM$ equals $\sqrt{n}$, which is a quick check that your arithmetic is consistent.
How to Interpret the Result
The standard error of 0.0537 is the typical distance between the sample mean of 10.0000 and the true mean $\mu$ of the process that produced these replicates. It is not the spread of the 12 individual values. That spread is the standard deviation, 0.1859, which is about 3.46 times larger.
Put another way, if you repeated this 12-replicate experiment many times, the sample means would cluster around $\mu$ with a standard deviation of roughly 0.0537. The individual measurements would still scatter with a standard deviation of roughly 0.1859. The standard error is smaller because averaging cancels part of the random noise.
This distinction is the reason the standard error should not be used as a descriptive statistic. Reporting it as if it described the data makes the measurements look more precise than they are [1]. When you report a mean, pair it with the standard deviation to describe the data, and use the standard error or a confidence interval to describe the precision of the mean [1]. The differences among these three quantities are laid out in standard deviation vs variance vs standard error.
Doing It in Software
In Python, the statistics module gives you the mean and the sample standard deviation with the $n-1$ denominator, and you finish with one division.
import statistics, math
data = [9.8, 10.1, 9.9, 10.3, 10.0, 9.7, 10.2, 9.9, 10.1, 10.0, 9.8, 10.2]
mean = statistics.mean(data)
sd = statistics.stdev(data)   # n-1 denominator
sem = sd / math.sqrt(len(data))
print(mean, sd, sem)
Output:
10.0 0.18586407545691688 0.053654336998865945In Excel, AVERAGE returns the mean and STDEV.S returns the sample standard deviation with the $n-1$ denominator. The standard error is STDEV.S(range)/SQRT(COUNT(range)). The full walkthrough with cell formulas is in how to calculate the standard error of the mean in Excel. In R, sd(x) returns the sample standard deviation, so sd(x)/sqrt(length(x)) gives the standard error.
Common Mistakes
- Reporting the SEM as if it described the data. The SEM measures precision of the mean, not variability of the observations. Fix: report the standard deviation alongside the mean when you describe the sample, and use the SEM only for precision [1].
- Dividing by $n$ instead of $\sqrt{n}$. The formula is $s / \sqrt{n}$. Dividing by $n$ understates the standard error and makes the estimate look more precise than it is.
- Using the population standard deviation formula. The $n-1$ denominator in $s$ matters most for small samples. Fix: use the sample standard deviation, which is
STDEV.Sin Excel andstatistics.stdevin Python. - Confusing the standard error with a confidence interval. The SEM is a single number, not a range. Fix: for a 95% interval, use $\bar{x} \pm 1.96 \cdot SEM$ for large samples, or a $t$-based multiplier for small ones.
- Assuming the SEM shrinks the data. A small SEM does not mean the individual measurements are tightly clustered. Fix: check the standard deviation before drawing conclusions about the data itself.
- Computing the SEM on a sample of one. With $n = 1$ the standard deviation is undefined and the standard error cannot be computed. Fix: collect more than one observation.
Limitations
The standard error of the mean describes the precision of an estimate, and it assumes the observations are independent and come from the same distribution. If your replicates are clustered, paired, or measured with changing conditions, the simple $s / \sqrt{n}$ formula understates the true uncertainty. It also says nothing about bias. A precise estimate of the wrong quantity is still wrong, and a small standard error cannot detect that.
The formula also assumes the sample mean is the quantity you care about. For medians, proportions, ratios, or regression coefficients, the standard error has a different form. And the SEM alone does not give you a probability statement about $\mu$. For that you need a confidence interval or a hypothesis test, which is why reporting a 95% confidence interval is usually preferred over reporting the SEM by itself [1].
Frequently Asked Questions
What is the difference between the standard error of the mean and the standard deviation?
The standard deviation describes how far individual observations fall from the sample mean. The standard error of the mean describes how far the sample mean is likely to fall from the population mean. The standard error is always smaller by a factor of $\sqrt{n}$, and it is a precision measure, not a descriptive one [1].
Does the standard error of the mean get smaller as the sample size grows?
Yes. Because the formula divides by $\sqrt{n}$, the standard error shrinks as $n$ increases. Going from 12 to 48 observations, for example, halves the standard error if the standard deviation stays the same. This is why larger samples give more precise estimates of the population mean.
Can the standard error of the mean be larger than the standard deviation?
No, not for a sample of two or more observations. Since $SEM = s / \sqrt{n}$ and $\sqrt{n} \ge 1$ whenever $n \ge 1$, the standard error is at most equal to the standard deviation. It equals the standard deviation only when $n = 1$, where the standard deviation is undefined anyway.
How do I turn the standard error into a confidence interval?
For a large sample, a 95% confidence interval is approximately $\bar{x} \pm 1.96 \cdot SEM$. For small samples, replace 1.96 with the appropriate $t$ multiplier for $n - 1$ degrees of freedom. In the worked example, that interval would be centered on 10.0000 with a half-width near $1.96 \times 0.0537$.
What sample size do I need for a small standard error?
It depends on the standard deviation of your measurements and how precise you need the estimate to be. Rearranging the formula gives $n = (s / SEM)^2$ for a target standard error. Sample size planning with the standard deviation is covered in sample size standard deviation formula.
References
Further Reading
- SE of Average
- NIST/SEMATECH e-Handbook of Statistical Methods
- Wasserstein RL, Lazar NA (2016). The ASA Statement on p -Values: Context, Process, and Purpose. The American Statistician
- Krzywinski M, Altman N (2013). Significance, P values and t-tests. Nature Methods
- OpenStax. Introductory Statistics 2e
Related Articles
- How to Calculate Standard Error of the Mean (SEM)
- Mean and Standard Deviation: Definition, Formula and Examples
- How to Calculate Standard Error of the Mean in Excel
- Harmonic Mean: Formula, Examples and When to Use It
- Standard Deviation of a Binomial Distribution: Formula and Example
- Sample size standard deviation formula
- Median Absolute Deviation: Formula and Worked Example
- Standard Deviation vs Variance vs Standard Error: What Each Measures and When to Report It