Mean of Interval: How to Find the Midpoint and Average
By Dr. Zubair Khalid, DVM, MS, PhD ·
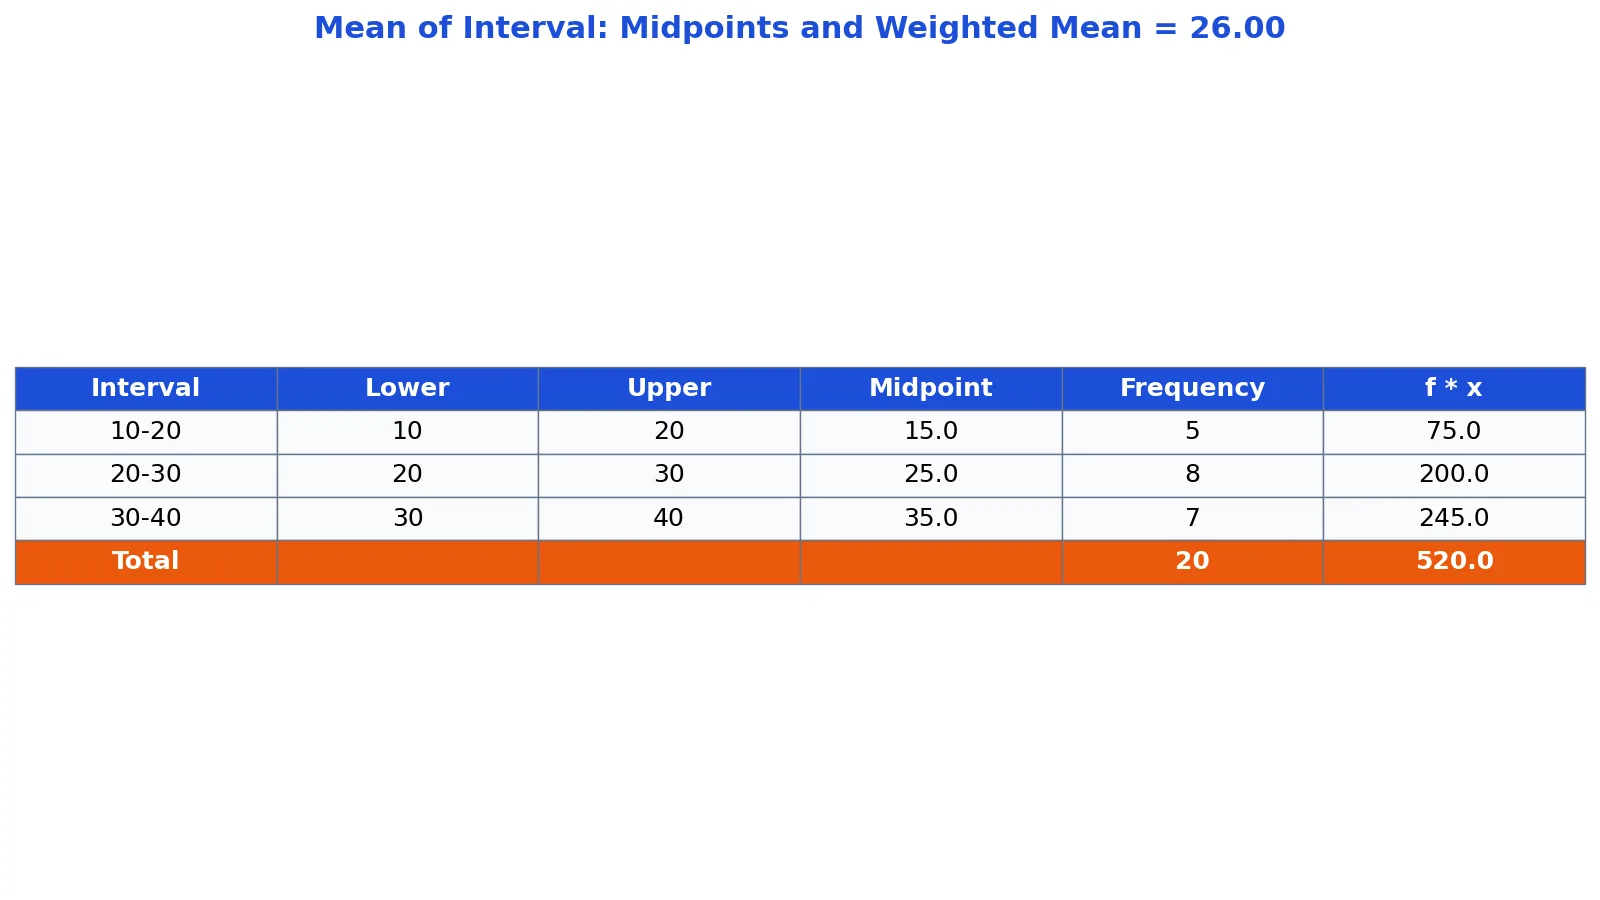
The mean of interval data is found by replacing each interval with its midpoint, then averaging those midpoints in proportion to how many values fall in each one. For a single interval $[a, b]$, the midpoint is simply $(a + b) / 2$. For grouped data, you weight each midpoint by its class frequency.
Quick Answer
- The midpoint of an interval with endpoints $a$ and $b$ is $\dfrac{a + b}{2}$.
- For grouped data, the mean of interval values is $\bar{x} = \dfrac{\sum f_i x_i}{\sum f_i}$, where $x_i$ is the midpoint of interval $i$ and $f_i$ is its frequency.
- The midpoint stands in for every value in the interval because you no longer know the individual observations.
- Frequencies act as weights, so intervals holding more data pull the mean toward them.
- In the example below, intervals 10-20, 20-30 and 30-40 with frequencies 5, 8 and 7 give a mean of 26.0000.
What the Mean of an Interval Means
An interval is the set of all real numbers between two fixed endpoints, with no gaps [1]. The interval $[10, 20]$ contains 10, 20 and every number in between. An open interval excludes its endpoints, and a closed interval includes both [1].
The midpoint of an interval is the value exactly halfway between the endpoints. It is the single number that best represents the center of that range.
The precise statistical definition is this: for grouped data, the mean of interval values is the frequency-weighted average of the class midpoints. Each midpoint $x_i$ is multiplied by its class frequency $f_i$, the products are summed, and that sum is divided by the total frequency. This is the standard grouped-data mean, and it is an approximation of the true mean you would get from the raw values.
How It Works
The formula for the mean of interval data is:
$$\bar{x} = \frac{\sum_{i=1}^{k} f_i x_i}{\sum_{i=1}^{k} f_i}$$
Each symbol means the following:
- $\bar{x}$ is the estimated mean of the grouped data.
- $k$ is the number of class intervals.
- $f_i$ is the frequency of interval $i$, meaning how many observations fall in it.
- $x_i$ is the midpoint of interval $i$, computed as $x_i = \dfrac{\text{lower}_i + \text{upper}_i}{2}$.
- $\sum f_i x_i$ is the sum of all frequency-times-midpoint products.
- $\sum f_i$ is the total number of observations, often written $N$.
The logic is straightforward. You cannot see the individual values inside a class, so you assume they sit at the center. Multiplying the midpoint by the frequency is equivalent to adding that midpoint to the sum once for every observation in the class. Dividing by $N$ then produces an ordinary arithmetic mean of those repeated midpoints.
If you want to check a small set of midpoints by hand, the Mean, Median & Mode Calculator will confirm your arithmetic quickly.
Worked Example
This example uses a grouped frequency table of class intervals with their frequencies, a common format in survey and exam-score summaries.
| Interval | Lower | Upper | Frequency |
|---|---|---|---|
| 10-20 | 10 | 20 | 5 |
| 20-30 | 20 | 30 | 8 |
| 30-40 | 30 | 40 | 7 |
Step 1. Find the midpoint of each interval.
- Midpoint of 10-20: $(10 + 20) / 2 = 15.0000$
- Midpoint of 20-30: $(20 + 30) / 2 = 25.0000$
- Midpoint of 30-40: $(30 + 40) / 2 = 35.0000$
Step 2. Multiply each midpoint by its frequency.
- $f \times x$ for 10-20: $5 \times 15.0000 = 75.0000$
- $f \times x$ for 20-30: $8 \times 25.0000 = 200.0000$
- $f \times x$ for 30-40: $7 \times 35.0000 = 245.0000$
Step 3. Add the frequencies and the products.
- Total frequency $N = 20$
- Sum of $f \times x = 520.0000$
Step 4. Divide.
- Weighted mean: $520.0000 / 20 = 26.0000$
The estimated mean is 26.0000. You can reproduce every number with this code.
import pandas as pd
df = pd.DataFrame({
    'Interval': ['10-20','20-30','30-40'],
    'Lower': [10,20,30], 'Upper': [20,30,40],
    'Frequency': [5,8,7],
})
df['Midpoint'] = (df['Lower'] + df['Upper']) / 2
df['f*x'] = df['Frequency'] * df['Midpoint']
mean = df['f*x'].sum() / df['Frequency'].sum()
print(mean)  # 26.0000
Output:
26.0000How to Interpret It
The value 26.0000 is an estimate of the average of the underlying observations, not the average of the interval labels. It sits inside the 20-30 class, which holds the largest frequency of 8, so the weighting pulls the result toward that interval's midpoint of 25.
Read the result as a center of gravity. If you placed each midpoint on a number line with a weight equal to its frequency, the mean is the point where the line would balance. Classes with higher frequencies move that balance point toward them.
The estimate is only as good as the midpoint assumption. If the data inside a class are skewed toward one end, the true mean will differ from the grouped estimate. The gap is usually small when classes are narrow and the data are roughly symmetric within each class.
When to Use It (and when not to)
Use the midpoint method when you only have summarized data. Grouped frequency tables, published reports and dashboards often give class intervals instead of raw values, and the weighted midpoint formula is the standard way to recover a mean from them.
Use it when intervals are of equal width, which keeps the midpoint assumption consistent across classes. It also works with unequal widths, but the approximation error tends to grow with wider classes.
Do not use it when you have the raw observations. Averaging the actual values is always more accurate than averaging midpoints. Do not use it for open-ended classes such as "50 or above," because those have no upper endpoint and therefore no midpoint. Do not use it for categorical or ordinal labels that only look numeric, since a midpoint implies equal spacing that may not exist. If your data are measured on a true interval scale with meaningful equal distances, the same midpoint logic applies, as covered in interval data definition and examples.
Mean of Interval vs Weighted Average
The mean of interval data is a special case of a weighted average. The midpoints are the values, and the frequencies are the weights. The general weighted average formula is the same structure, but the weights can be anything, such as credits, prices or proportions.
| Feature | Mean of interval data | General weighted average |
|---|---|---|
| Values used | Class midpoints | Any measured or assigned values |
| Weights | Class frequencies | Any weights you choose |
| Typical use | Grouped frequency tables | Grades, portfolios, index numbers |
| Formula | $\dfrac{\sum f_i x_i}{\sum f_i}$ | $\dfrac{\sum w_i x_i}{\sum w_i}$ |
| Accuracy | Approximate, depends on class width | Exact if weights and values are exact |
If your weights are not counts, the step-by-step weighted average guide walks through the same arithmetic with different inputs. When you want to compare this center with another measure of center, see mean vs median differences.
Common Mistakes
- Using the interval label instead of the midpoint. "10-20" is not a number you can average. Fix: compute $(10 + 20) / 2 = 15$ first.
- Forgetting to weight by frequency. Averaging the midpoints 15, 25 and 35 gives 25, which ignores that the classes hold different counts. Fix: multiply each midpoint by its frequency before summing.
- Dividing by the number of classes instead of the total frequency. With three classes you might divide by 3. Fix: divide by $N = \sum f_i$, which is 20 here.
- Assuming the grouped mean equals the true mean. It is an estimate. Fix: report it as approximate, or use raw data when available.
- Mixing up class boundaries and class limits. If intervals are written as 10-20, 21-30, the true boundaries may be 9.5 to 20.5. Fix: use consistent boundaries when the table defines them.
- Trying to find a midpoint for an open-ended class. "40+" has no upper bound. Fix: leave it out, or state the assumption you used for its width.
Limitations
The midpoint method cannot recover information that grouping destroyed. Every observation in a class is treated as if it sits exactly at the center, so any within-class spread or skew is invisible. Two datasets with identical class frequencies but very different internal distributions will produce the same grouped mean.
The estimate also depends on how the classes were defined. Wider classes and fewer of them increase the error, and shifting the class boundaries can change the result even when the underlying data are unchanged. For precise work, treat the grouped mean as a summary of the table, not as a substitute for the raw values. If you need to describe spread as well, the mean and standard deviation guide explains what additional measures require.
Frequently Asked Questions
What is the midpoint of an interval?
The midpoint is the value exactly halfway between the two endpoints. For an interval from $a$ to $b$, it is $(a + b) / 2$. For 10-20, the midpoint is 15. The midpoint represents the center of the class and stands in for all values inside it.
How do you find the mean of grouped interval data?
Multiply each class midpoint by its frequency, add those products, then divide by the total frequency. The formula is $\bar{x} = \sum f_i x_i / \sum f_i$. In the worked example, the sum of $f \times x$ is 520 and the total frequency is 20, giving 26.0000.
Is the grouped mean the same as the actual mean?
No. It is an approximation. The grouped mean assumes every value in a class equals the class midpoint. If the raw data are available, averaging them directly gives the exact mean. The two values get closer as class widths shrink.
Can you find the mean of an open-ended interval?
Not directly, because an open-ended class such as "50 or above" has no upper endpoint, so no midpoint can be computed. Common practice is to exclude that class, or to assign it a plausible width based on the other classes and state that assumption clearly.
What if the intervals have different widths?
The formula still works, since each midpoint is computed from its own endpoints. Unequal widths do increase approximation error, because a wide class covers more unknown values than a narrow one. When possible, prefer equal-width classes for grouped summaries.
References
Further Reading
- Interval Estimates - Chebyshev
- 7.2.4.1. Confidence intervals
- NIST/SEMATECH e-Handbook of Statistical Methods
- OpenStax. Introductory Statistics 2e
- Krzywinski M, Altman N (2013). Importance of being uncertain. Nature Methods
Related Articles
- Interval Scale Questions: Examples and How to Use Them
- Standard Error of the Mean: Formula and Example
- Interval Data: Definition, Examples and When to Use It
- Mean vs Median: Differences and When to Use Each
- Mean and Standard Deviation: Definition, Formula and Examples
- How to Find Mode: Mean, Median, Mode Guide
- Median Absolute Deviation: Formula and Worked Example
- Verification of Reference Intervals and Reportable Range