How to Calculate Standard Error of the Mean in Excel
By Dr. Zubair Khalid, DVM, MS, PhD ·
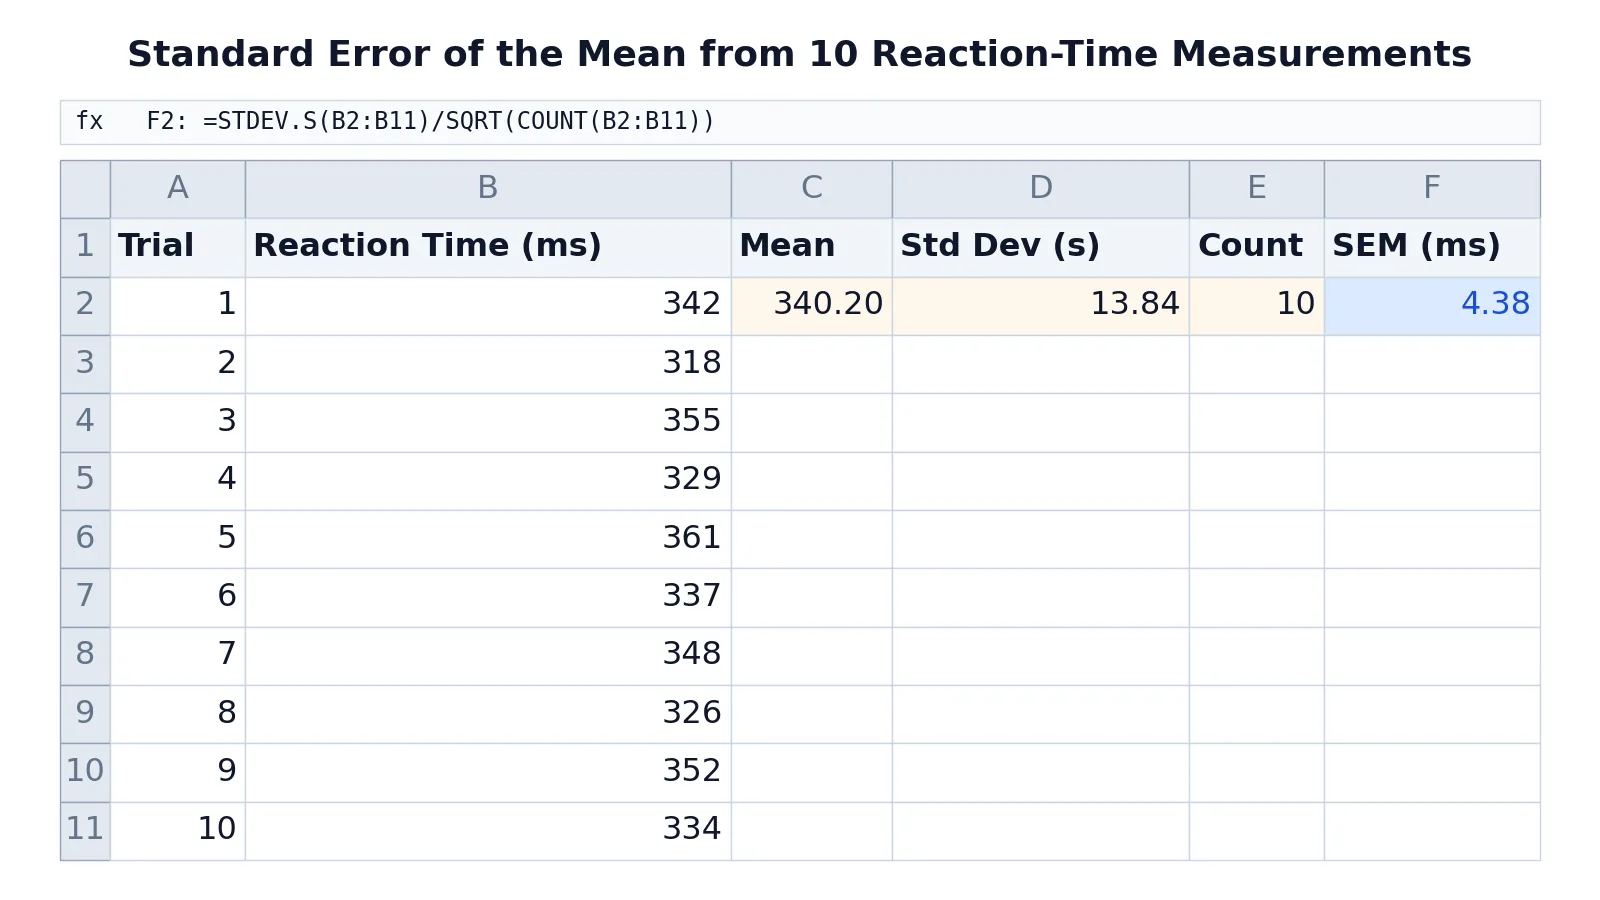
To calculate the standard error of the mean in Excel, divide the sample standard deviation by the square root of the count: =STDEV.S(range)/SQRT(COUNT(range)). This article shows exactly how to calculate SEM in Excel, step by step, with a worked example you can copy. If you need the underlying logic first, see how to calculate standard error of the mean.
Quick Answer
- The formula is
=STDEV.S(range)/SQRT(COUNT(range)). STDEV.Sreturns the sample standard deviation using the n-1 method [1].COUNTreturns how many numeric values are in the range.SQRTtakes the square root of that count.- For the 10 reaction times below, the result is 4.38 ms.
Before You Start
You need one column of numeric measurements, with one value per row and no blank rows inside the range. The standard error of the mean measures how much a sample mean is expected to vary from sample to sample. It is the sample standard deviation divided by the square root of the sample size:
$$SEM = \frac{s}{\sqrt{n}}$$
Here $s$ is the sample standard deviation and $n$ is the number of observations. Excel has no built-in SEM function, so you build it from two functions that do exist. STDEV.S estimates standard deviation based on a sample and uses the n-1 method [1]. COUNT counts numeric cells, which gives you $n$.
Two decisions matter before you type anything. First, use the sample standard deviation, not the population version, unless your data really is the entire population. Second, make sure your range contains only the numbers you want counted. Text, empty cells, and error values are ignored by STDEV.S when they appear in a range reference [1], and COUNT ignores them too, so a stray label will not break the formula but a stray number will change it.
Step by Step
- Put your measurements in a single column, for example B2:B11.
- Click an empty cell where you want the SEM to appear.
- Type
=STDEV.S(B2:B11)/SQRT(COUNT(B2:B11))and press Enter. - Check the result against the mean and standard deviation to confirm the range is right.
- Format the cell to a sensible number of decimal places.
That single formula is the whole calculation. If you prefer to see the pieces, split it across cells as in the worked example below. Splitting is useful when you also want to report the mean and standard deviation, and it makes errors easier to spot.
If you want to review the standard deviation step on its own, see how to calculate standard deviation in Excel. If you need the mean for reporting alongside the SEM, see how to calculate the mean in Excel.
Worked Example
The dataset is 10 reaction-time measurements in milliseconds, one per trial.
| A | B | C | D | E | F | |
|---|---|---|---|---|---|---|
| 1 | Trial | Reaction Time (ms) | Mean | Std Dev (s) | Count | SEM (ms) |
| 2 | 1 | 342 | =AVERAGE(B2:B11) -> displays 340.20 | =STDEV.S(B2:B11) -> displays 13.84 | =COUNT(B2:B11) -> displays 10 | =STDEV.S(B2:B11)/SQRT(COUNT(B2:B11)) -> displays 4.38 |
| 3 | 2 | 318 | ||||
| 4 | 3 | 355 | ||||
| 5 | 4 | 329 | ||||
| 6 | 5 | 361 | ||||
| 7 | 6 | 337 | ||||
| 8 | 7 | 348 | ||||
| 9 | 8 | 326 | ||||
| 10 | 9 | 352 | ||||
| 11 | 10 | 334 |
The four steps behind cell F2:
- Compute the sample mean of the 10 reaction times in C2. The result is 340.20 ms.
- Compute the sample standard deviation (n-1) in D2. The result is 13.84.
- Count the numeric reaction-time measurements in E2. The result is 10.
- Divide the standard deviation by the square root of the count in F2. The result is 4.38 ms.
So the mean reaction time is 340.20 ms with a standard error of 4.38 ms. The (s) in the D1 header is the symbol for the sample standard deviation, not seconds. The standard deviation is in the same units as the data, milliseconds.
Other Ways to Do It
You can write the same calculation with STDEV instead of STDEV.S. Both estimate standard deviation based on a sample and both use the n-1 method [1]. Microsoft notes that STDEV has been replaced by newer functions and is kept for backward compatibility, so STDEV.S is the better choice in current versions [1].
You can also use STDEVA, which estimates standard deviation based on a sample and also uses the n-1 method [2]. The difference is how it treats values in a reference. STDEVA evaluates TRUE as 1 and text or FALSE as 0, while empty cells in the reference are ignored [2]. For clean numeric data, STDEV.S and STDEVA return the same answer. Use STDEV.S unless you deliberately want logical values counted.
If you want to avoid typing the range twice, put the standard deviation in one cell and the count in another, then reference them. That is what the worked example does, and it is easier to audit.
Do not use STEYX for this. STEYX returns the standard error of the predicted y-value for each x in a regression, which is a different quantity [3].
If you want to check your arithmetic outside Excel, the Standard Deviation Calculator will confirm the standard deviation you feed into the formula.
Troubleshooting
The result is #DIV/0!. COUNT returned zero, which means the range holds no numeric values. Check that the range points at your data and that the numbers are stored as numbers, not as text.
The result is #VALUE!. One of the arguments is non-numeric in a way Excel cannot translate. STDEV.S returns an error when an argument is an error value or text that cannot be converted to a number [1].
The result looks far too small. You probably divided by the count instead of the square root of the count. The denominator is $\sqrt{n}$, not $n$.
The result looks far too large. Your range probably includes numbers that are not part of the sample, such as a total row or an ID column.
The result changes when you add a row. That is expected. Both $s$ and $n$ change when the sample changes, so the SEM changes too.
Common Mistakes
- Using
STDEV.PorSTDEVP. Those compute the population standard deviation and divide by $n$ internally. For a sample, useSTDEV.S, which uses the n-1 method [1]. Fix: swap the function name. - Dividing by
COUNTinstead ofSQRT(COUNT). This understates the standard error badly. Fix: wrap the count inSQRT. - Counting the wrong range. If
COUNTcovers a wider range thanSTDEV.S, the two halves of the formula disagree. Fix: use the identical range in both functions. - Including a total row or a header in the range. A numeric total gets counted as an observation. Fix: select only the data rows.
- Confusing SEM with standard deviation. The standard deviation describes spread of individual values. The SEM describes the precision of the mean. Fix: label the column clearly and report both.
- Reporting the SEM as a confidence interval. The SEM is one component of a confidence interval, not the interval itself. Fix: if you need an interval, compute it separately.
Limitations
The formula assumes your observations are independent and come from a single sample. If your rows are repeated measurements from the same subject, or grouped in clusters, the standard error computed this way will be too small and will overstate your precision. It also assumes you are describing one group. If you need the SEM per group, you have to compute it per group.
Excel will happily return a number for very small samples, but that number is unstable. With two or three observations, the sample standard deviation is a poor estimate of the population value, and the SEM inherits that weakness. The formula also says nothing about the shape of your data. For strongly skewed data or data with outliers, the mean and its standard error may not be the best summary, and a median with a different measure of uncertainty may describe the data better. For background on how variability feeds into sample-size planning, see sample size standard deviation formula.
Frequently Asked Questions
What is the exact Excel formula for SEM?
=STDEV.S(range)/SQRT(COUNT(range)). Replace range with your data range, such as B2:B11. STDEV.S gives the sample standard deviation using the n-1 method [1], and COUNT gives the number of numeric values.
Is there a built-in SEM function in Excel?
No. Excel provides STDEV.S, STDEV, and STDEVA for standard deviation, but no function returns the standard error of the mean directly [1][2]. You combine the standard deviation with the square root of the count.
Should I use STDEV.S or STDEV in the formula?
Either works for a sample, because both use the n-1 method [1]. Microsoft recommends the newer functions because STDEV is kept only for backward compatibility and may not be available in future versions [1]. Use STDEV.S in current versions.
Why does my SEM differ from someone else's calculation?
The usual causes are a different range, a different denominator, or a different standard deviation function. If one of you used the population standard deviation and the other used the sample version, the results will not match. Compare the standard deviation and the count first, then compare the final division.
Can I calculate SEM for several columns at once?
Yes. Write the formula for the first column, then fill it across. Each column needs its own range reference. If your data is arranged with groups in rows instead of columns, you will need to adjust the references accordingly, and a variance calculation can help you confirm the spread before you trust the SEM.
References
- STDEV function | Microsoft Support
- STDEVA function | Microsoft Support
- STEYX function | Microsoft Support
Further Reading
- CONFIDENCE function | Microsoft Support
- Broman KW, Woo KH (2018). Data Organization in Spreadsheets. The American Statistician
- Ziemann M, Eren Y, El-Osta A (2016). Gene name errors are widespread in the scientific literature. Genome Biology