Expected Value: Definition, Formula and Examples
By Dr. Zubair Khalid, DVM, MS, PhD ·
The expected value of a random variable is the probability-weighted average of all its possible outcomes. It tells you what you would get on average if you repeated the same random experiment many times. For a discrete random variable, you multiply each outcome by its probability and add the products.
Quick Answer
- Expected value is the long-term average outcome of a random experiment repeated many times [1].
- The formula for a discrete random variable is $E(X) = \sum x_i \cdot P(X = x_i)$ [1].
- It is also called the mean, the expectation, or $\mu$, and all these names refer to the same quantity [2].
- Each outcome is weighted by its probability, so rare outcomes pull the average less than common ones [3].
- An expected value of 0 in a betting game means a fair game, a positive value favors you, and a negative value favors the house [4].
What Expected Value Means
In plain terms, the expected value is the average you would see if you ran the same random process over and over. Toss three fair coins a large number of times and the expected value of the number of heads is the count you expect per three tosses on average [1]. It is a single number that summarizes the center of a probability distribution.
The precise statistical definition: for a discrete random variable $X$ with possible values $x_1, x_2, \dots, x_n$ and corresponding probabilities $P(X = x_i)$, the expected value is the sum of each value multiplied by its probability [1]. It is written $E(X)$, $\mu_x$, or just $\mu$ [3]. Statisticians describe it as the center of mass of the probability distribution, the point where a probability histogram would balance if it were a thin sheet of metal [2].
One detail matters. The expected value does not have to be a value the variable can actually take. A fair six-sided die has an expected value of 3.5, yet you can never roll a 3.5. The number describes the long-run average, not any single roll [3].
How It Works
The formula for a discrete random variable is:
$$E(X) = \sum_{i=1}^{n} x_i \cdot P(X = x_i)$$
Each symbol means the following.
- $X$ is the random variable, the quantity whose outcome is uncertain.
- $x_i$ is one possible value of $X$.
- $P(X = x_i)$ is the probability that $X$ takes that value.
- $\sum$ means you add the products across every possible value.
The mechanism is a weighted average. Each outcome contributes in proportion to how likely it is. An outcome with probability 0.5 carries ten times the weight of an outcome with probability 0.05. The probabilities across all outcomes must sum to 1, so the weights are balanced.
A useful way to organize the arithmetic is an expected value table. You list the values in one column, the probabilities in a second column, and the product $x \cdot P(x)$ in a third, then add the last column [5]. That layout keeps the work checkable and is the same structure you would use for a weighted average in Excel.
Worked Example
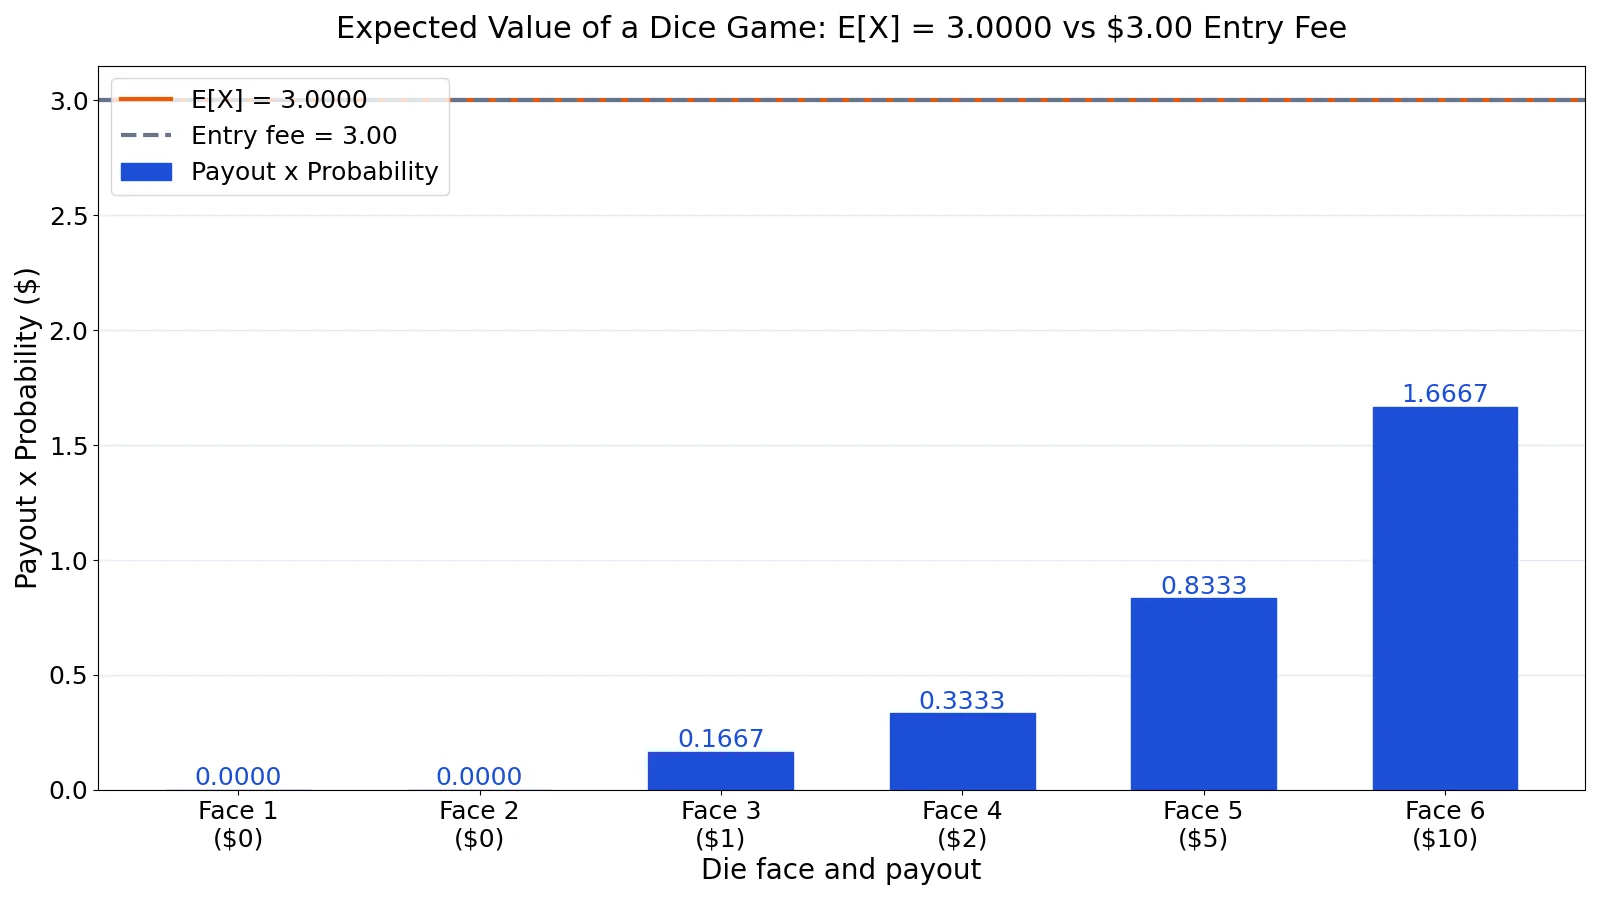
A game charges a $3.00 entry fee. You roll a fair six-sided die once and receive the payout shown for the face that lands. The table below lists each face, its payout, its probability, and the product of the two.
| Face | Payout ($) | Probability | Payout × Probability |
|---|---|---|---|
| 1 | 0 | 0.1667 | 0.0000 |
| 2 | 0 | 0.1667 | 0.0000 |
| 3 | 1 | 0.1667 | 0.1667 |
| 4 | 2 | 0.1667 | 0.3333 |
| 5 | 5 | 0.1667 | 0.8333 |
| 6 | 10 | 0.1667 | 1.6667 |
Each face has probability $1/6 \approx 0.1667$. Multiply each payout by its probability:
- Face 1: $0 \times 0.1667 = 0.0000$
- Face 2: $0 \times 0.1667 = 0.0000$
- Face 3: $1 \times 0.1667 = 0.1667$
- Face 4: $2 \times 0.1667 = 0.3333$
- Face 5: $5 \times 0.1667 = 0.8333$
- Face 6: $10 \times 0.1667 = 1.6667$
Sum the weighted payouts:
$$0.0000 + 0.0000 + 0.1667 + 0.3333 + 0.8333 + 1.6667 = 3.0000$$
So $E(X) = 3.0000$. Subtract the $3.00 entry fee to get the net expected profit:
$$3.0000 - 3.0000 = 0.0000$$
The net expected profit is $0.0000. By the standard definition, a game with an expected value of zero is a fair game [4].
The same calculation in Python:
import numpy as np
payouts = np.array([0, 0, 1, 2, 5, 10])
probs = np.array([1/6]*6)
E_X = (payouts * probs).sum()  # 3.0000
net = E_X - 3.0  # 0.0000
print(f"E[X] = {E_X:.4f}, net = {net:.4f} (fair)")
Output:
E[X] = 3.0000, net = 0.0000 (fair)How to Interpret It
Read the expected value as the average result per trial over a very large number of trials. If you played this dice game thousands of times, your average payout per roll would settle near $3.00, and your average net result would settle near $0.00. The expected value will not tell you what happens on any single roll [4].
The sign of a net expected value is the practical signal in games of chance. A positive net value means you have an advantage over the long run, a negative net value means the house has the advantage, and zero means the game is fair [4]. The same logic applies outside gambling. A hot dog vendor who knows the probability of selling zero, one, or two toppings can compute the expected number of toppings per hot dog and use it to plan inventory [4].
The expected value is also the reference point for spread. Once you have the mean, you can measure how far outcomes typically sit from it, which is what the standard deviation of a distribution does [5]. If you want to see how a mean and a spread are reported together for data, the mean and standard deviation article walks through that pairing.
When to Use It (and when not to)
Use the expected value when you need a single summary number for a random process and you can list the outcomes with their probabilities. It fits decisions about pricing, insurance, inventory, and any repeated bet or contract where the long-run average is the right yardstick [6].
Use it when the outcomes are discrete and the probabilities are known or well estimated. A raffle with a fixed number of tickets, a lottery with a known draw size, and a die game all qualify [6].
Do not rely on it alone when the distribution is highly skewed or when a single extreme outcome dominates. The mean can sit far from any typical outcome, and a decision maker who cares about the worst case needs more than the average. Do not use it as a forecast for one trial. It describes the long run, not the next roll [4].
Expected Value vs Sample Mean
These two ideas are close relatives but they are not the same thing. The expected value is a property of a probability distribution. The sample mean is a statistic computed from observed data [5].
| Feature | Expected Value | Sample Mean |
|---|---|---|
| Source | Probability distribution | Observed data |
| Symbol | $E(X)$ or $\mu$ | $\bar{x}$ |
| Formula | $\sum x_i \cdot P(X = x_i)$ | Sum of values divided by count |
| Meaning | Theoretical long-run average | Average of the values you collected |
| Known in advance | Yes, if probabilities are known | No, computed after sampling |
As the number of trials grows, the sample mean tends to approach the expected value [5]. For the mechanics of the data-based version, see the sample mean article.
Common Mistakes
- Treating the expected value as a possible outcome. A die's expected value of 3.5 is not a face. Fix: describe it as a long-run average, not a predicted result.
- Forgetting to subtract the cost. A payout expectation of $3.00 against a $3.00 fee is a net of $0.00. Fix: always compute the net value when money changes hands.
- Using probabilities that do not sum to 1. The weights must total 1 or the average is meaningless. Fix: check the probability column before multiplying.
- Averaging the outcomes without weighting. Adding the payouts and dividing by six ignores that outcomes have different probabilities. Fix: multiply each outcome by its own probability first [6].
- Confusing the expected value with the sample mean. One comes from a distribution, the other from data. Fix: check whether you have probabilities or observations.
- Assuming a positive expected value guarantees a profit. A positive average still allows long losing streaks. Fix: pair the expected value with a measure of spread.
Limitations
The expected value compresses a whole distribution into one number, so it hides the shape. Two very different distributions can share the same mean. If one has a small chance of a huge loss, the average alone will not warn you about the risk, and you need the variance or standard deviation alongside it [5].
The formula also assumes you know the probabilities. In many real settings you estimate them from data, and the expected value inherits any error in those estimates. For a continuous random variable, you cannot sum probability-weighted values because there are infinitely many, so the calculation becomes an integral over the probability density function instead [3]. That is a different tool for a different setting.
Frequently Asked Questions
How do you find the expected value?
Multiply each possible value of the random variable by its probability, then add all the products [1]. For a discrete variable with values $x_i$ and probabilities $P(X = x_i)$, that is $E(X) = \sum x_i \cdot P(X = x_i)$. An expected value table with a product column makes the arithmetic easy to check [5].
Can the expected value be a number that never occurs?
Yes. The expected value is an average, not a guaranteed outcome. A fair six-sided die has an expected value of 3.5 even though no face shows 3.5 [3]. The same is true for counts, where an expected number of 1.1 events per week is perfectly valid [5].
What does an expected value of zero mean?
It means the game or process is fair. Over many repetitions, gains and losses cancel out and the average result is zero [4]. In a betting context, a zero expected value means neither side has a long-run advantage, while a negative value means the player loses on average.
What is the difference between expected value and probability?
Probability tells you how likely a single outcome is. Expected value combines the outcomes and their probabilities into one average [6]. For example, the probability of rolling a 6 is about 0.1667, while the expected payout of a die game accounts for all six faces at once.
Is expected value the same as the mean?
For a random variable, yes. The expected value is also called the mean, the expectation, or $\mu$, and these terms are used interchangeably [2]. The distinction to watch is between the mean of a distribution and the mean of a sample of data, which is written $\bar{x}$ [5].
References
- 4.2 Mean or Expected Value and Standard Deviation - Statistics | OpenStax
- Stat 20 - Expected value and variance of a random variable
- Expected Value and Variance
- 3.3: Expected Value - Mathematics LibreTexts/03%3A_Probability/3.03%3A_Expected_Value)
- 5.3: Mean or Expected Value and Standard Deviation - Statistics LibreTexts
- CM Expected Value
Further Reading
Related Articles
- Formula for Range: Definition, Formula and Examples
- Covariance Formula: Definition and Calculation Examples
- Mean and Standard Deviation: Definition, Formula and Examples
- Probability of A Given B: Conditional Probability Formula and Examples
- t Statistic Formula: Definition, Calculation and Examples
- P-Value Formula and Interpretation: A Researcher
- Statistical Parameter: Definition, Types, and Estimation
- Understanding Model Assumptions in Statistical Analysis