Covariance Formula: Definition and Calculation Examples
By Dr. Zubair Khalid, DVM, MS, PhD ·
The formula for covariance measures whether two variables tend to move in the same direction or in opposite directions. It averages the product of each variable's deviation from its own mean. A positive result means the variables rise and fall together, a negative result means one rises as the other falls, and a value near zero means there is no consistent linear pattern.
Quick Answer
- The sample covariance is $cov = \frac{\sum_{i=1}^{n}(x_i - \bar{x})(y_i - \bar{y})}{n - 1}$ [1][2].
- The numerator is the sum of products, the paired deviations multiplied together and added up [3].
- Divide by $n - 1$ for a sample, or by $n$ for a population [2].
- The sign tells you the direction of the relationship, and the size depends on the units of your data [1].
- Covariance is not standardized, so you cannot compare its magnitude across different measurement scales [1][4].
The Formula
The sample covariance of two variables $x$ and $y$ is:
$$cov(x, y) = \frac{\sum_{i=1}^{n}(x_i - \bar{x})(y_i - \bar{y})}{n - 1}$$
Each symbol means the following:
| Symbol | Meaning |
|---|---|
| $x_i$ | The value of variable $x$ for observation $i$ |
| $y_i$ | The value of variable $y$ for the same observation $i$ |
| $\bar{x}$ | The mean of all $x$ values |
| $\bar{y}$ | The mean of all $y$ values |
| $n$ | The number of paired observations |
| $\sum$ | Summation, add up every term |
The term $(x_i - \bar{x})$ is how far one observation sits from the mean of $x$. The term $(y_i - \bar{y})$ does the same for $y$. Multiplying them gives a crossproduct, and the sum of those crossproducts goes in the numerator [3]. When both variables are above their means or both below, the product is positive. When one is above and the other below, the product is negative [1].
The population version divides by $n$ instead of $n - 1$ [2]. The $n - 1$ denominator corrects for the fact that you are estimating from a sample, the same logic behind the sample variance equation.
How to Calculate It Step by Step
- List your paired data. Every observation needs a value for both variables.
- Compute the mean of $x$ and the mean of $y$.
- Subtract the mean of $x$ from each $x$ value to get the $x$ deviations.
- Subtract the mean of $y$ from each $y$ value to get the $y$ deviations.
- Multiply each pair of deviations to get the crossproducts.
- Add all the crossproducts to get the sum of products.
- Divide the sum of products by $n - 1$ for a sample covariance, or by $n$ for a population covariance.
Worked Example
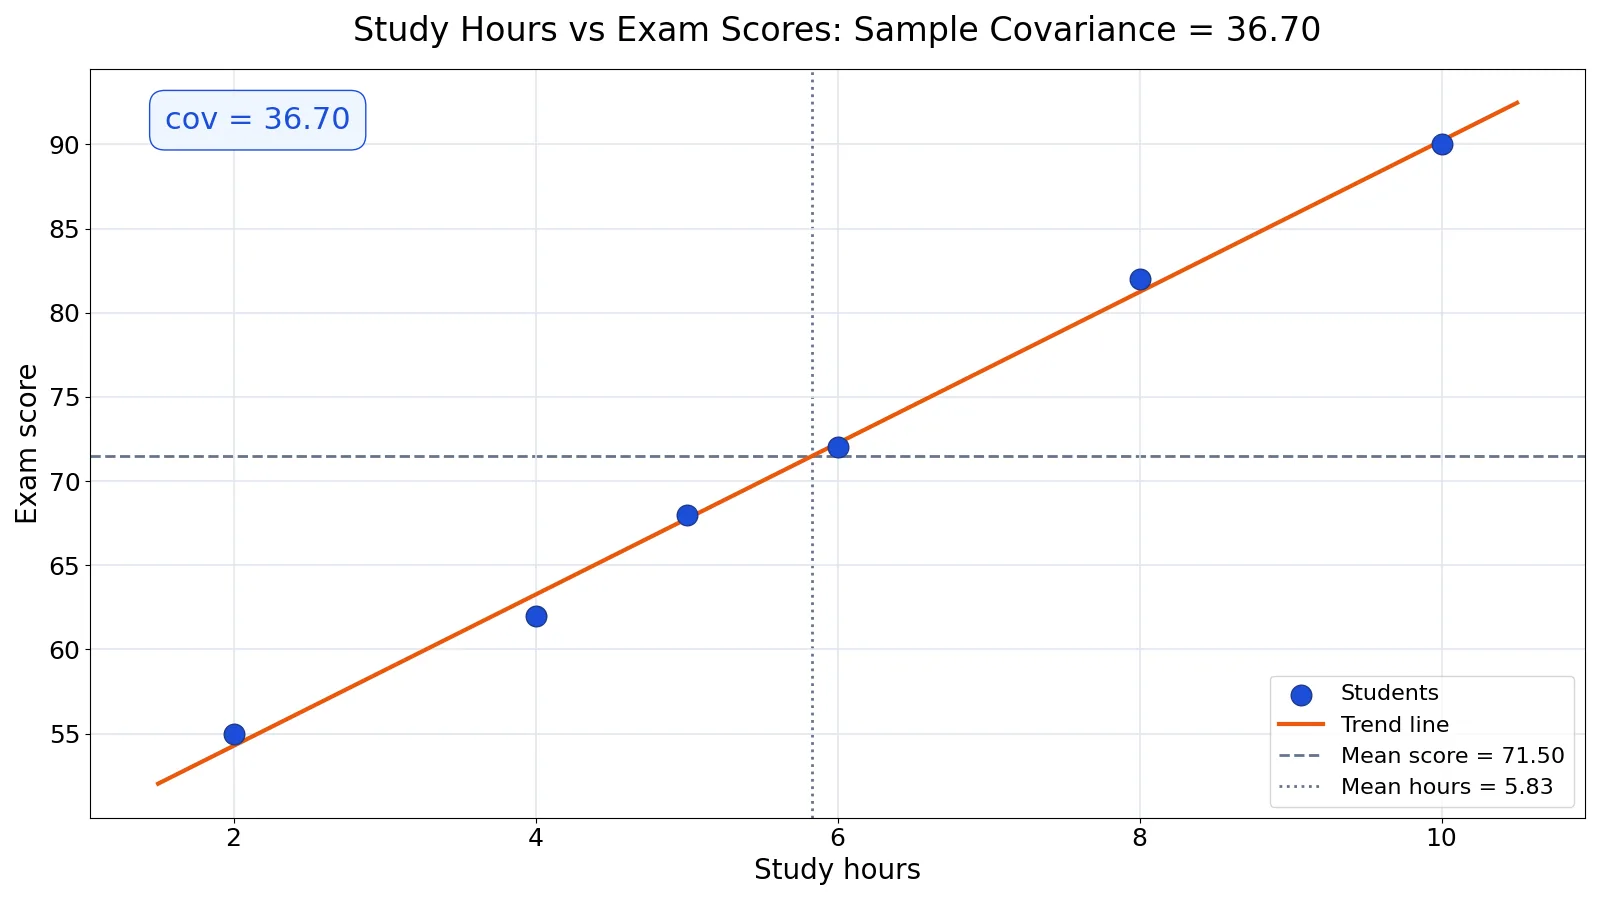
Six students reported their weekly study hours and their exam scores. The data are paired by student, so each row contributes one crossproduct.
| student_id | study_hours (x) | exam_score (y) |
|---|---|---|
| 1 | 2 | 55 |
| 2 | 4 | 62 |
| 3 | 5 | 68 |
| 4 | 6 | 72 |
| 5 | 8 | 82 |
| 6 | 10 | 90 |
Here $n = 6$, with $x = [2, 4, 5, 6, 8, 10]$ and $y = [55, 62, 68, 72, 82, 90]$.
Step 1. Find the means.
$$mean_x = \frac{2 + 4 + 5 + 6 + 8 + 10}{6} = 5.8333$$
$$mean_y = \frac{55 + 62 + 68 + 72 + 82 + 90}{6} = 71.5000$$
Step 2. Compute the deviations from each mean.
| x | x - mean_x | y | y - mean_y |
|---|---|---|---|
| 2 | -3.83 | 55 | -16.50 |
| 4 | -1.83 | 62 | -9.50 |
| 5 | -0.83 | 68 | -3.50 |
| 6 | 0.17 | 72 | 0.50 |
| 8 | 2.17 | 82 | 10.50 |
| 10 | 4.17 | 90 | 18.50 |
Step 3. Multiply each pair of deviations.
| (x - mean_x)(y - mean_y) |
|---|
| -3.83 × -16.50 = 63.25 |
| -1.83 × -9.50 = 17.42 |
| -0.83 × -3.50 = 2.92 |
| 0.17 × 0.50 = 0.08 |
| 2.17 × 10.50 = 22.75 |
| 4.17 × 18.50 = 77.08 |
Step 4. Add the crossproducts.
$$sum\ of\ products = 63.25 + 17.42 + 2.92 + 0.08 + 22.75 + 77.08 = 183.5000$$
Step 5. Divide by $n - 1$.
$$cov = \frac{183.5000}{6 - 1} = \frac{183.5000}{5} = 36.7000$$
The sample covariance is 36.70. For comparison, the population covariance divides by $n$ instead: $183.5000 / 6 = 30.5833$.
How to Interpret the Result
The sign is the first thing to read. A positive covariance means the two variables move in the same direction, so as one goes up the other tends to go up [3][5]. A negative covariance means they move in opposite directions, an inverse relation where one rises as the other falls [3]. A covariance of zero means there is no consistent linear relationship, so one variable does not change in a predictable way as the other changes [5].
In the example, the covariance of 36.70 is positive, so students who studied more hours tended to score higher on the exam. The units are hours times points, which is why the raw number is hard to read on its own.
The magnitude is where covariance gets awkward. Because it is built from the raw deviations, its size depends on the scale of both variables [1]. Change study hours to minutes and the covariance multiplies by 60 without the relationship changing at all. That is why analysts usually divide the covariance by the two standard deviations to get a correlation, which is a dimensionless number between -1 and +1 [1][4]. If you want to compare the strength of two relationships, use correlation instead of covariance.
Doing It in Software
You rarely compute covariance by hand beyond a few observations. Python, R, and Excel all have built-in functions.
import numpy as np
hours = [2, 4, 5, 6, 8, 10]
scores = [55, 62, 68, 72, 82, 90]
cov = np.cov(hours, scores, ddof=1)[0, 1]
print(cov)  # 36.7000
The output is:
36.7The ddof=1 argument sets the divisor to $n - 1$, matching the sample formula. In Excel, the worksheet function =COVARIANCE.S(A2:A7,B2:B7) returns the sample covariance for the same data. When you have more than two variables, the pairwise covariances are usually collected into a covariance matrix, which holds variances on the diagonal and covariances off the diagonal [2].
Common Mistakes
- Dividing by $n$ when you have a sample. Use $n - 1$ for sample data and $n$ only when you have the full population [2]. The fix is to check whether your data is a sample or the entire group before choosing the denominator.
- Mismatching the pairs. Each $x$ value must be paired with the $y$ value from the same observation. Sorting one column without the other destroys the pairing and gives a meaningless result.
- Reading the magnitude as strength. A covariance of 500 is not "stronger" than one of 5 if the variables are measured on different scales [1]. Standardize with correlation before comparing.
- Assuming zero covariance means no relationship. Covariance only captures linear association. Two variables can have a strong curved relationship and still show a covariance near zero [3].
- Forgetting the units. Covariance carries the product of both variables' units, such as square dollars or hours times points [4]. Report the units or convert to correlation.
- Using the wrong means. Always subtract the mean of the same variable, not the mean of the other one. Mixing them up flips signs and inflates the result.
Limitations
Covariance tells you the direction of a linear relationship and nothing more. It cannot tell you whether one variable causes the other, and it cannot detect a strong nonlinear pattern. A U-shaped relationship can produce a covariance near zero even though the two variables are tightly linked [3].
The other limitation is scale dependence. Because the value is expressed in the product of the two variables' units, it is not comparable across datasets or measurement systems [1][4]. For any decision about strength, ranking, or comparison, convert to correlation by dividing the covariance by the product of the two standard deviations [1]. Covariance is most useful as an intermediate step, particularly inside variance sums and covariance matrices, where the formula $Var(X + Y) = Var(X) + Var(Y) + 2 \cdot Cov(X, Y)$ does real work [4].
Frequently Asked Questions
What is the difference between sample and population covariance?
The only difference is the denominator. Sample covariance divides the sum of products by $n - 1$, while population covariance divides by $n$ [2]. The sample version is larger in absolute value because it corrects for estimating the means from the data. Use the sample formula whenever your data is a subset of a larger group.
Can covariance be negative?
Yes. A negative covariance means the two variables move in opposite directions, so as one increases the other tends to decrease [3]. This is called an inverse relation. The sign always matches the sign of the sum of products, so if the crossproducts add up to a negative number, the covariance is negative [5].
What does a covariance of zero mean?
A covariance of zero means there is no consistent linear relationship between the two variables [5]. As one variable changes, the other does not change in a predictable linear way. Be careful, because a zero covariance does not rule out a strong nonlinear relationship.
How do I calculate covariance in Excel?
Use the COVARIANCE.S function for sample data, entering the two ranges as arguments, for example =COVARIANCE.S(A2:A7,B2:B7). For population data, use COVARIANCE.P with the same two ranges. Both functions require the two ranges to have the same number of cells and to be aligned row by row.
Why is covariance hard to interpret on its own?
Its size depends on the units and spread of both variables, so the same relationship can produce very different covariance values depending on how you measure things [1][4]. Dividing the covariance by the product of the two standard deviations gives the correlation, a unitless number between -1 and +1 that is comparable across studies [1].
References
- 24.3: Covariance and Correlation - Statistics LibreTexts/24%3A_Modeling_Continuous_Relationships/24.03%3A_Covariance_and_Correlation)
- 6.5.4.1. Mean Vector and Covariance Matrix
- 13.1: Variability and Covariance - Statistics LibreTexts
- Correlation
- 14.6: Correlation Formula- Covariance Divided by Variability - Statistics LibreTexts_WITHOUT_UNITS/14%3A_Correlations/14.06%3A_Correlation_Formula-__Covariance_Divided_by_Variability)
Further Reading
Related Articles
- What Is a Covariance Matrix? Definition, Formula and Examples
- Correlation vs Covariance: Differences and When to Use Each
- Sample Variance Equation: Formula, Steps and Examples
- t Statistic Formula: Definition, Calculation and Examples
- Formula for Range: Definition, Formula and Examples
- Predictor vs. Covariate: Clarifying Terminology in Research
- Statistical Parameter: Definition, Types, and Estimation
- Operationalizing Variables in Hypothesis Formulation: A Step-by-Step Template