Mean and Standard Deviation: Definition, Formula and Examples
By Dr. Zubair Khalid, DVM, MS, PhD ·
The mean and the standard deviation (sd) are the two numbers most often reported together to describe a dataset. The mean tells you where the center of the data sits, and the sd tells you how far values typically fall from that center. Read together, the sd and mean give you a compact picture of both location and spread.
Quick Answer
- The mean is the arithmetic average: add every value and divide by how many values you have [1].
- The standard deviation measures the typical distance of values from the mean. A small sd means values cluster near the mean, a large sd means they are spread out [2].
- For a sample, the mean is $\bar{x} = \frac{\sum x}{n}$ and the sample sd is $s = \sqrt{\frac{\sum (x - \bar{x})^2}{n-1}}$.
- The sd is always zero or positive. It is zero only when every value is identical.
- The mean and sd are usually reported as a pair, such as "mean = 82.00, sd = 8.39," because one number alone hides how variable the data is.
What Mean and Standard Deviation Mean
In plain terms, the mean is the balance point of your data. If you placed every value on a number line, the mean is the spot where the line would balance. The standard deviation is the size of a typical step away from that balance point.
The precise definitions are worth knowing. The mean of a sample, written $\bar{x}$, is the sum of all values in the sample divided by the number of values in the sample [1]. The mean of a population, written $\mu$, is the sum of all values in the population divided by the population size [1].
The standard deviation describes the scatter around the mean. You start with each value's deviation from the mean, square it so positive and negative deviations do not cancel, average those squared deviations, then take the square root to return to the original units [2]. That square root step is what makes the sd readable in the same units as your data.
How It Works
The two formulas work as a pair. First you find the center, then you measure distances from it.
Sample mean:
$$\bar{x} = \frac{\sum x}{n}$$
Sample standard deviation:
$$s = \sqrt{\frac{\sum (x - \bar{x})^2}{n-1}}$$
Each symbol means the following:
| Symbol | Meaning |
|---|---|
| $x$ | Each individual value in the dataset |
| $\bar{x}$ | The sample mean |
| $\sum$ | Sum of everything that follows |
| $n$ | The number of values in the sample |
| $n - 1$ | Degrees of freedom used for the sample variance |
| $s$ | The sample standard deviation |
The $n - 1$ in the denominator is called Bessel's correction. Dividing by $n - 1$ instead of $n$ makes the sample sd a slightly larger and less biased estimate of the population sd. If you are working with an entire population rather than a sample, you divide by $n$ and use the symbol $\sigma$.
The same logic extends to sampling. If you draw repeated samples of size $n$ from a population with mean $\mu$ and standard deviation $\sigma$, the sample means themselves have a mean equal to $\mu$ and a standard deviation of $\sigma / \sqrt{n}$ [3]. That relationship is the foundation of the standard error of the mean.
Worked Example
The dataset is the exam scores of 12 students in a class.
| student_id | exam_score |
|---|---|
| 1 | 72 |
| 2 | 85 |
| 3 | 90 |
| 4 | 68 |
| 5 | 77 |
| 6 | 95 |
| 7 | 81 |
| 8 | 88 |
| 9 | 74 |
| 10 | 92 |
| 11 | 79 |
| 12 | 83 |
Step 1: Sum the scores.
$$\sum x = 984.0000$$
Step 2: Divide by n to get the mean.
$$\bar{x} = \frac{984.0000}{12} = 82.0000$$
Step 3: Square each deviation from the mean and add them.
$$\sum (x - \bar{x})^2 = 774.0000$$
Step 4: Divide by n - 1 to get the sample variance.
$$s^2 = \frac{774.0000}{12 - 1} = 70.3636$$
Step 5: Take the square root to get the sample sd.
$$s = \sqrt{70.3636} = 8.3883$$
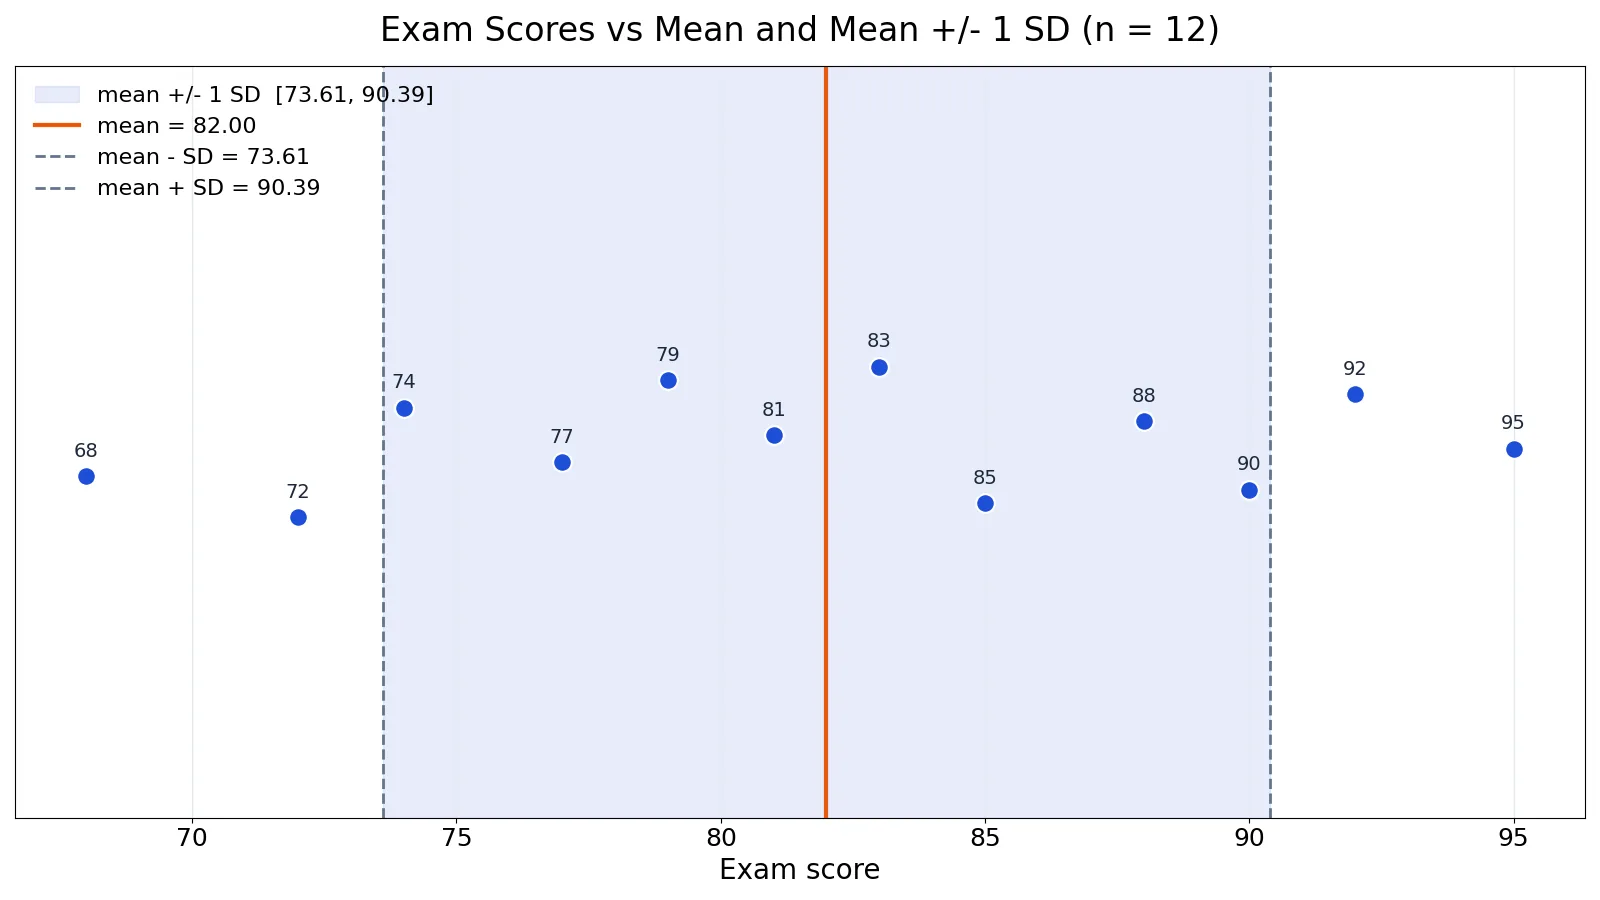
The mean is 82.00 and the sample sd is 8.39. One sd below the mean is 73.6117 and one sd above is 90.3883. Eight of the 12 scores fall inside that band: 85, 90, 77, 81, 88, 74, 79, and 83. Four fall outside: 72, 68, 95, and 92.
Here is the same calculation in Python.
import numpy as np
scores = np.array([72, 85, 90, 68, 77, 95, 81, 88, 74, 92, 79, 83])
mean = scores.mean()
sd = scores.std(ddof=1)  # sample SD, matches Excel STDEV.S
print(f"mean = {mean:.4f}, sample SD = {sd:.4f}")
Output:
mean = 82.0000, sample SD = 8.3883You can reproduce this with the Standard Deviation Calculator or check the center with the Mean, Median & Mode Calculator.
How to Interpret It
The mean gives you the expected value of a single draw from the data. The sd tells you how wrong that expectation is likely to be. In the example, a score of 82 is the center, and a typical score sits about 8.39 points away from it.
The mean plus or minus one sd is a useful reference band. In many roughly bell-shaped datasets, about two-thirds of values fall within one sd of the mean. In this small dataset, 8 of 12 scores, or 67 percent, land inside the band, which matches that pattern closely.
The sd also lets you compare values across datasets. A score of 90 means something different in a class with sd 8.39 than in a class with sd 2. The distance from the mean in sd units is called a z-score, and it standardizes values so they can be compared directly.
When you report results, give both numbers. "Mean = 82.00, sd = 8.39" tells a reader far more than "mean = 82.00" alone. For a deeper look at how the sd relates to variance and standard error, see Standard Deviation vs Variance vs Standard Error.
When to Use It (and when not to)
Use the mean and sd when your data are roughly symmetric and measured on an interval or ratio scale, such as heights, test scores, temperatures, or reaction times. They are the default summary for continuous data and the inputs to most parametric tests.
Avoid the mean as your center when the data are heavily skewed or contain extreme outliers. A single very large value pulls the mean toward it, and the sd inflates with it. In those cases the median and a spread measure such as the median absolute deviation describe the data better. For a direct comparison, see Mean vs Median: Differences and When to Use Each.
The sd is also a poor summary for categorical data. You cannot average categories, so the mean and sd do not apply. Use counts and proportions instead.
Mean and Standard Deviation vs Variance
Variance and standard deviation measure the same thing, spread, but on different scales. Variance is the average squared deviation. The sd is its square root.
| Feature | Standard Deviation | Variance |
|---|---|---|
| Units | Same as the data | Squared units |
| Formula (sample) | $s = \sqrt{\frac{\sum (x-\bar{x})^2}{n-1}}$ | $s^2 = \frac{\sum (x-\bar{x})^2}{n-1}$ |
| Typical use | Reporting and interpreting spread | Mathematical work and derivations |
| Sensitivity to outliers | High | Higher, because deviations are squared |
| Example value | 8.3883 | 70.3636 |
Because the sd is in the same units as the data, it is easier to interpret. Variance is more convenient in algebra, which is why many formulas are written in terms of it. For a fuller treatment, see Measures of Variability: Range, Variance and Standard Deviation.
Common Mistakes
- Dividing by n instead of n - 1 for a sample. This underestimates the population sd. Use $n - 1$ for sample data and $n$ only when you have the full population.
- Forgetting to take the square root. The value before the square root is the variance, not the sd. Reporting 70.3636 as the sd would be wrong by a factor of about 8.4.
- Averaging the deviations without squaring them. The positive and negative deviations cancel to zero, so the average deviation is always zero [2]. Squaring is what keeps the measure meaningful.
- Reporting the mean without the sd. A mean of 82 could come from tightly clustered scores or wildly scattered ones. Always report spread alongside center.
- Using the mean and sd on skewed data. Outliers drag both numbers. Check a histogram or dot plot before you commit to them.
- Confusing the sd of the data with the sd of the mean. The standard error, $\sigma / \sqrt{n}$, shrinks as sample size grows [3]. The sd of the data does not.
Limitations
The mean and sd are sensitive to outliers. One extreme value can shift the mean and inflate the sd enough to misrepresent the rest of the data. They also assume a meaningful arithmetic scale, so they are not appropriate for ordinal ratings or categorical labels.
The sd says nothing about the shape of a distribution. Two datasets can share the same mean and sd while looking completely different, one symmetric and one bimodal. Always pair the numbers with a plot. The mean and sd also do not capture the precision of the mean itself, which is the job of the standard error [3].
Frequently Asked Questions
What does the standard deviation tell you that the mean does not?
The mean tells you the center of the data. The sd tells you how far values typically sit from that center. Together they describe both location and spread, which is why they are reported as a pair.
Should I use n or n - 1 when calculating the sd?
Use $n - 1$ when your data are a sample drawn from a larger population. Use $n$ when you have measured the entire population. Most statistical software defaults to $n - 1$ for the sample sd, which is why the Python example uses ddof=1.
Can the standard deviation be negative?
No. The sd is the square root of a variance, and a variance is a sum of squared values, so it can never be negative. The smallest possible value is zero, which happens only when every value in the dataset is identical.
What percentage of data falls within one standard deviation of the mean?
For roughly bell-shaped data, about two-thirds of values fall within one sd of the mean. In the worked example, 8 of 12 scores, or 67 percent, fell inside the band from 73.61 to 90.39. This rule of thumb is approximate and does not hold for skewed data.
How do I calculate the mean and sd in Excel?
Use AVERAGE for the mean and STDEV.S for the sample standard deviation. STDEV.S uses the $n - 1$ denominator. If you have the full population, use STDEV.P instead, which divides by $n$.
References
- 5.2: Mean and Standard Deviation - Mathematics LibreTexts/05%3A_Discrete_Random_Variables/5.03%3A_Mean_or_Expected_Value_and_Standard_Deviation)
- Mean, Variance, and Standard Deviation
- 6.1: The Mean and Standard Deviation of the Sample Mean - Statistics LibreTexts/06%3A_Sampling_Distributions/6.01%3A_The_Mean_and_Standard_Deviation_of_the_Sample_Mean)
Further Reading
- NIST/SEMATECH e-Handbook of Statistical Methods
- OpenStax. Introductory Statistics 2e
- Krzywinski M, Altman N (2013). Importance of being uncertain. Nature Methods
Related Articles
- Standard Deviation of a Binomial Distribution: Formula and Example
- Standard Error of the Mean: Formula and Example
- Sample Mean: Definition, Formula and Examples
- Measures of Variability: Range, Variance and Standard Deviation
- Harmonic Mean: Formula, Examples and When to Use It
- Standard Deviation vs Variance vs Standard Error: What Each Measures and When to Report It
- Statistical Parameter: Definition, Types, and Estimation
- Median Absolute Deviation: Formula and Worked Example