What Is Data Literacy? Skills and Examples
By Dr. Zubair Khalid, DVM, MS, PhD ·
Data literacy is the ability to read, understand, create, and communicate data as information [1]. It covers a set of skills, not one single talent, and those skills apply to a weather report, a workplace dashboard, or a research dataset. This article defines data literacy, breaks down the skills it includes, and walks through a worked example with real numbers.
Quick Answer
- Data literacy is the ability to read, work with, analyze, and communicate with data [2].
- It is a set of skills, not one skill, and people sit at different points along that spectrum [3].
- The four pillars are reading data, understanding data, analyzing data, and communicating data [3].
- Data can be quantitative (numbers) or qualitative (words), and both types count as data you need to read [4].
- Data literacy supports daily decisions, from reading a weather report to judging how public money is allocated [5].
What Data Literacy Means
In plain terms, data literacy is your ability to make sense of data and to use it to answer a question or support a decision. One library guide defines it as an individual's ability to read, understand, and use data [4]. Another defines it as the ability to read, analyze, create, manage, and talk about data [5]. A third frames it as the ability to read, understand, create, and communicate data as information [1].
A definition used by many educators, from Rahul Bhargava and Catherine D'Ignazio, states that data literacy is "the ability to read, work with, analyze, and argue with data," four skills that reside across a spectrum [3]. He describes four core pillars: reading data, understanding data, analyzing data, and communicating data [3]. That framing matters because it separates data literacy from tool knowledge. Knowing how to open a spreadsheet is not the same as knowing whether the numbers in it answer your question.
Data literacy also has a personal side. Understanding how data functions helps you protect your own privacy and information, and it informs decisions you make as a citizen, a student, and a worker [5]. If you want to go deeper on the raw material itself, see What Is Data? Definition, Meaning and Examples in Science.
How It Works
Data literacy is not a single formula, but you can measure it. A common approach is to score people on each skill and compare the averages. The mechanism is the arithmetic mean and the sample standard deviation.
The mean of a set of scores is:
$$\bar{x} = \frac{\sum_{i=1}^{n} x_i}{n}$$
Here $\bar{x}$ is the mean, $x_i$ is each individual score, $\sum$ means "add up all the values," and $n$ is the number of scores. The mean tells you the typical score for a group.
The sample standard deviation is:
$$s = \sqrt{\frac{\sum_{i=1}^{n}(x_i - \bar{x})^2}{n-1}}$$
Here $s$ is the sample standard deviation, $x_i - \bar{x}$ is how far each score sits from the mean, and $n-1$ is the degrees of freedom used for a sample. The standard deviation tells you how spread out the scores are. A small value means most people scored close to the mean. A large value means scores were scattered.
Worked Example
The dataset below holds scores from 0 to 10 for 20 employees on four data literacy skills: Data Collection, Data Cleaning, Analysis, and Visualization.
| employee_id | Data Collection | Data Cleaning | Analysis | Visualization |
|---|---|---|---|---|
| 1 | 8 | 7 | 6 | 9 |
| 2 | 6 | 5 | 7 | 8 |
| 3 | 9 | 8 | 8 | 7 |
| 4 | 7 | 6 | 5 | 6 |
| 5 | 5 | 4 | 6 | 5 |
| 6 | 8 | 9 | 7 | 8 |
| 7 | 6 | 7 | 8 | 9 |
| 8 | 7 | 8 | 6 | 7 |
| 9 | 9 | 7 | 9 | 8 |
| 10 | 4 | 5 | 4 | 6 |
| 11 | 7 | 6 | 7 | 7 |
| 12 | 8 | 8 | 8 | 9 |
| 13 | 6 | 5 | 5 | 5 |
| 14 | 9 | 9 | 8 | 8 |
| 15 | 5 | 6 | 7 | 6 |
| 16 | 7 | 7 | 6 | 8 |
| 17 | 8 | 6 | 7 | 7 |
| 18 | 6 | 8 | 9 | 8 |
| 19 | 7 | 5 | 6 | 7 |
| 20 | 9 | 8 | 7 | 9 |
Step 1. Sum the Data Collection scores. The total is 141 across 20 employees.
Step 2. Divide by the count. The mean for Data Collection is 141 / 20 = 7.0500.
Step 3. Measure the spread. The sample standard deviation for Data Collection is 1.4681.
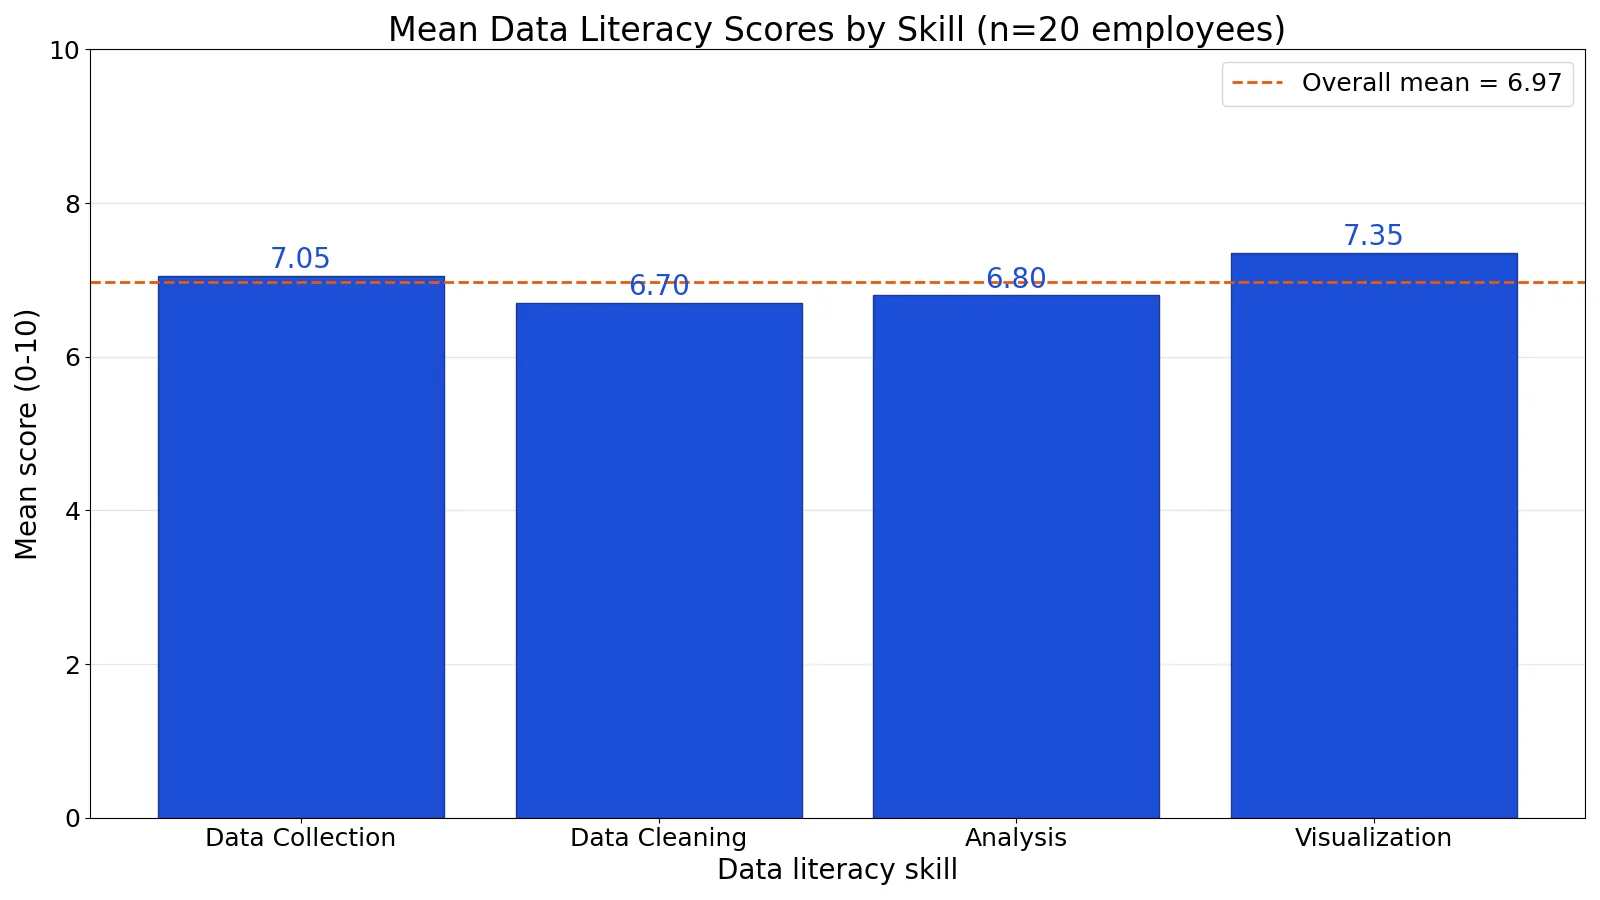
Step 4. Repeat for the other three skills. Data Cleaning sums to 134, so the mean is 134 / 20 = 6.7000 with a sample standard deviation of 1.4546. Analysis sums to 136, so the mean is 136 / 20 = 6.8000 with a sample standard deviation of 1.3219. Visualization sums to 147, so the mean is 147 / 20 = 7.3500 with a sample standard deviation of 1.2680.
Step 5. Average the four skill means. The overall mean is (7.0500 + 6.7000 + 6.8000 + 7.3500) / 4 = 6.9750.
The highest-scoring skill is Visualization at 7.35. The lowest-scoring skill is Data Cleaning at 6.70.
Here is the same calculation in Python for one skill column:
import statistics
scores = [8, 6, 9, 7, 5, 8, 6, 7, 9, 4, 7, 8, 6, 9, 5, 7, 8, 6, 7, 9]  # Data Collection column
mean = statistics.mean(scores)   # 7.0500
sd   = statistics.stdev(scores)  # 1.4681
Output:
means = [7.05, 6.7, 6.8, 7.35]
sample_sds = [1.4681, 1.4546, 1.3219, 1.268]
overall_mean = 6.9750
How to Interpret It
Read the means first. Visualization at 7.35 is the strongest average skill in this group, and Data Cleaning at 6.70 is the weakest. The gap between them is 0.65 points on a 0 to 10 scale, which is a modest difference, not a dramatic one.
Read the standard deviations next. Data Collection has the largest spread at 1.4681, so scores there vary the most. Visualization has the smallest spread at 1.2680, so those scores cluster more tightly around the mean. A mean without a spread tells you only half the story.
Compare each skill against the overall mean of 6.9750. Data Collection and Visualization sit above it. Data Cleaning and Analysis sit below it. If you were planning training, the two below-average skills are the natural starting point.
This is the same reasoning you apply to any dataset. Before you trust a number, ask how it was collected, whether it is current, who collected it, and what their purpose was [4]. Check whether the presentation is misleading, such as a chart axis that starts above zero [4]. Those questions are the reading and understanding pillars in action.
When to Use It (and when not to)
Use data literacy whenever a decision depends on numbers. That includes reading a dashboard at work, evaluating a study, checking a claim in a news story, or deciding how to spend a budget [5]. It also applies when you create data, because creating a chart or a summary is part of the skill set [1].
Use it when you need to argue with data, meaning you can defend a conclusion and explain its limits [3]. That is the difference between repeating a statistic and understanding it.
Do not treat data literacy as a substitute for domain expertise. Knowing how to read a medical dataset does not make you a clinician. Do not treat a single course as the finish line either, because building these dispositions takes time and patience [5]. And do not assume a high score on one skill means strength in all of them, since the pillars are separate [3].
Data Literacy vs Statistical Literacy
The two overlap heavily, but they are not identical. Statistical literacy centers on statistical concepts and methods. Data literacy is broader and includes finding, managing, cleaning, and communicating data.
| Aspect | Data Literacy | Statistical Literacy |
|---|---|---|
| Core focus | Reading, working with, analyzing, and communicating data [2] | Statistical concepts and reasoning |
| Typical tasks | Finding, cleaning, visualizing, explaining data | Choosing tests, interpreting estimates and uncertainty |
| Scope | Covers the full data workflow [5] | Focuses on analysis and inference |
| Shared ground | Both require reading and understanding data [4] | Both require reading and understanding data [4] |
In practice you need both. Data literacy gets the data ready and explains it. Statistical literacy helps you judge whether the analysis is sound. For the preparation side, see What Is Data Wrangling? Definition, Steps and Examples.
Common Mistakes
- Treating data literacy as one skill. It is a set of skills across a spectrum [3]. Fix: assess each pillar separately, as the worked example does.
- Skipping the source check. People accept a number without asking who collected it or why [4]. Fix: ask how the data was collected, whether it is current, and whether bias is present [4].
- Ignoring the spread. A mean alone hides how much scores vary. Fix: report the standard deviation alongside every mean.
- Confusing data with information. Data becomes information only after you read and interpret it [1]. Fix: state what the number means before you present it.
- Assuming tool skills equal literacy. Knowing a spreadsheet menu is not the same as understanding a dataset. Fix: practice interpretation, not just clicks.
- Forgetting the communication pillar. Analysis nobody understands changes nothing [3]. Fix: write the finding in one plain sentence before you build the chart.
Limitations
Data literacy frameworks describe skills, not outcomes. A high score on a self-assessment or a skills test does not guarantee that someone makes good decisions with data. The scores in the worked example are ordinal in spirit, so the distance between a 7 and an 8 is not guaranteed to equal the distance between a 5 and a 6. Averaging them is a convenience, not a precise measurement.
Definitions also vary across sources. Some stress reading, understanding, and using data [4]. Others add creating, managing, and talking about data [5]. Others stress reading, working with, analyzing, and arguing with data [3]. That variation means comparisons across studies or organizations can be shaky. Pick one definition, state it, and apply it consistently.
Frequently Asked Questions
What are the core data literacy skills?
The four commonly cited pillars are reading data, understanding data, analyzing data, and communicating data [3]. Some definitions add creating and managing data to that list [5]. Together they cover the full path from finding a dataset to explaining what it shows.
Is data literacy the same as data analysis?
No. Data analysis is one pillar inside data literacy [3]. Data literacy also includes reading data, understanding its context, and communicating results to others [2]. You can be a strong analyst and still struggle to explain your findings.
Do I need to know programming to be data literate?
No. The definitions focus on reading, understanding, analyzing, and communicating data, not on specific tools [1]. Spreadsheets and charts are enough to practice every pillar. Programming helps at scale, but it is not the definition of literacy.
How do I measure data literacy in a team?
Score each person on each skill, then compute the mean and standard deviation per skill, as in the worked example. The means show where the team is strong or weak. The standard deviations show how consistent the team is. For a fuller picture of the roles involved, see What Does a Data Analyst Do? Roles, Skills, and Career Path.
Why does data literacy matter in daily life?
Data informs routine decisions, from reading a weather report to deciding who to vote for or how money for social services is allocated [5]. It also helps you protect your own privacy and information [5]. The skills transfer directly from the classroom to everyday choices.
References
- Data Literacy - Statistics and Data - Gleeson Library at University of San Francisco
- Data Literacy | University Analytics and Institutional Research
- Data Literacy - ANR 310 - LibGuides at Michigan State University Libraries
- Data Literacy - CNX 100 - Information Literacy Guide - LibGuides at Ohio Wesleyan University Libraries
- Data Literacy - Technology & Computing - City University of Seattle Library at City University of Seattle
Further Reading
Related Articles
- Dataset Examples: Types of Data Sets With Real Samples
- What Is Data Wrangling? Definition, Steps and Examples
- What Is a Dataset? Definition, Types and Examples
- What Is Data? Definition, Meaning and Examples in Science
- Quantitative Data Examples: Definition and Types
- What Is a Data Dictionary? A Practical Guide for Research Teams
- How to Become a Data Analyst: Education, Skills, and Certification Paths
- What Does a Data Engineer Do? Building the Infrastructure for Data Science