What Is the Mode in Statistics? Definition and Examples
By Dr. Zubair Khalid, DVM, MS, PhD ·
The mode is the value that appears most often in a dataset. If you want to know what is mode in statistics, think of it as the "most popular" answer: the score, size, or category that shows up more times than any other. Unlike the mean and median, the mode works for text categories as well as numbers, which makes it the only average you can compute for things like eye color or product names.
Quick Answer
- The mode is the most frequently occurring value in a dataset.
- A dataset can have one mode, several modes, or no mode at all.
- You find it by counting how often each value appears and picking the highest count.
- It works for numeric and categorical data, unlike the mean and median.
- The mode ignores the actual size of values, so it can sit far from the center.
What the Mode Means
In plain language, the mode is the value you see most often. If five people order vanilla ice cream, three order chocolate, and two order strawberry, the mode is vanilla. It is the winner of a simple popularity contest.
The precise statistical definition is narrower. The mode is the value $x$ in a dataset whose frequency is greater than or equal to the frequency of every other value. In symbols, for a set of observations, the mode is the value with the maximum count. A dataset with one such value is unimodal, one with two is bimodal, and one with three or more is multimodal. If every value appears the same number of times, the dataset has no mode.
The mode is one of the three common measures of central tendency, alongside the mean and the median. It belongs to the family of descriptive statistics, which summarize a dataset without drawing conclusions beyond it 6.
How It Works
Finding the mode does not require a formula in the usual sense. It requires counting. The mechanism is a frequency table, and the mode is the value with the largest frequency.
For a dataset with values $x_1, x_2, \dots, x_n$, you count how many times each distinct value occurs:
$$f(x) = \text{number of observations equal to } x$$
The mode is then:
$$\text{Mode} = \arg\max_{x} f(x)$$
Here is what each part means.
- $x$ is any distinct value in the dataset.
- $f(x)$ is the frequency of that value, meaning how many times it appears.
- $n$ is the total number of observations.
- $\arg\max$ means "the value of $x$ that makes $f(x)$ as large as possible."
If two values tie for the highest frequency, both are modes. If every value has frequency 1, there is no mode. Software follows the same logic. In SciPy, scipy.stats.mode returns the modal value and its bin count, and when more than one value ties it returns only one of them 1.
Worked Example
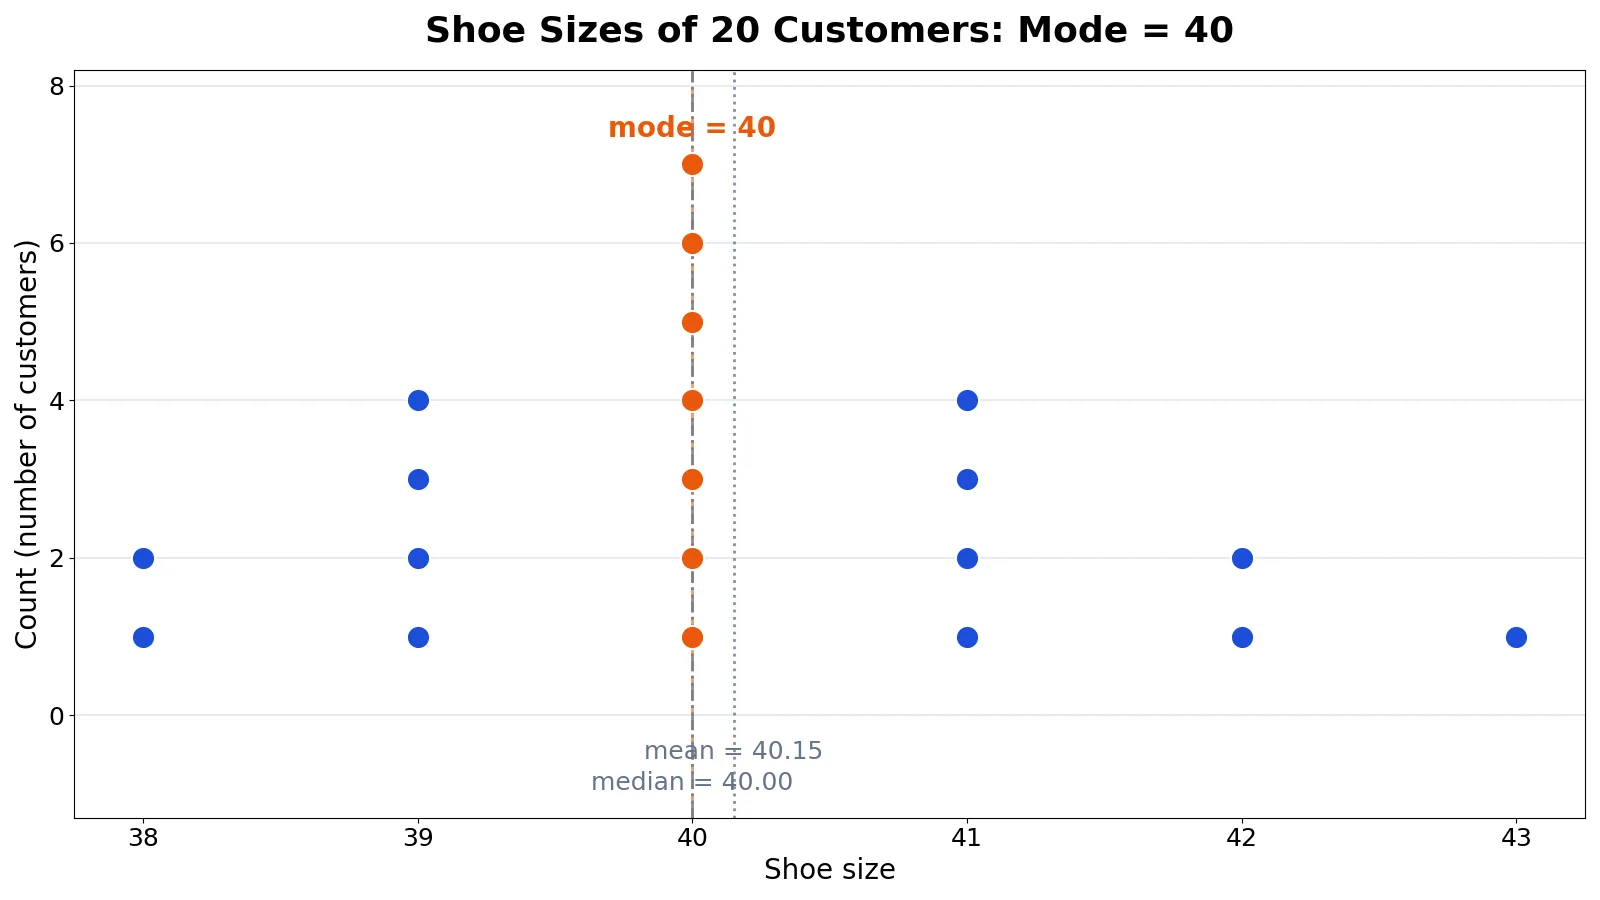
A retail store records the shoe sizes of 20 customers who bought shoes in one day. The goal is to find the size that sold most often.
| customer_id | shoe_size | customer_id | shoe_size |
|---|---|---|---|
| 1 | 38 | 11 | 40 |
| 2 | 39 | 12 | 40 |
| 3 | 39 | 13 | 41 |
| 4 | 40 | 14 | 41 |
| 5 | 40 | 15 | 42 |
| 6 | 40 | 16 | 43 |
| 7 | 41 | 17 | 39 |
| 8 | 42 | 18 | 40 |
| 9 | 38 | 19 | 40 |
| 10 | 39 | 20 | 41 |
Step 1. Count the observations. The dataset size is n = 20.
Step 2. Sort the values: [38, 38, 39, 39, 39, 39, 40, 40, 40, 40, 40, 40, 40, 41, 41, 41, 41, 42, 42, 43].
Step 3. Build the frequency table.
| Shoe size | Frequency |
|---|---|
| 38 | 2 |
| 39 | 4 |
| 40 | 7 |
| 41 | 4 |
| 42 | 2 |
| 43 | 1 |
Step 4. Pick the highest frequency. Size 40 appears 7 times, more than any other size, so the mode is 40.
For comparison, the mean is 803 / 20 = 40.1500 and the median is the average of the 10th and 11th sorted values, (40 + 40) / 2 = 40.0000. The range is 43 - 38 = 5. All three averages land close together here, which is not always the case.
You can reproduce this in Python.
import statistics
from collections import Counter

sizes = [38, 39, 39, 40, 40, 40, 41, 42, 38, 39, 40, 40, 41, 41, 42, 43, 39, 40, 40, 41]
mode = statistics.mode(sizes)
counts = Counter(sizes)
print(mode, counts[mode])  # prints the mode and how often it occurs
Output:
40 7The mode is 40, appearing 7 times. The mean is 40.1500 and the median is 40.0000.
How to Interpret It
The mode tells you which value is most common, not which value is typical in the sense of balancing the data. In the shoe example, size 40 is the mode because it sold most often, which is exactly what a store needs to know when deciding how many pairs of each size to stock.
Interpret the mode together with its frequency. A mode that appears 7 times out of 20 is a strong signal. A mode that appears 3 times out of 100 is barely a pattern at all. The gap between the top frequency and the next one matters too. If size 40 appears 7 times and size 39 appears 6 times, the "most popular" label is thin.
For categorical data, the mode is often the only sensible average. If you survey customers about their preferred contact method and 60 percent choose email, the mode is email. There is no meaningful mean or median for that variable.
When to Use It (and when not to)
Use the mode when your data are categorical, such as brand names, colors, or yes/no answers. Use it when you care about the most frequent outcome, such as the best-selling product size or the most common diagnosis code. Use it when the distribution has a clear peak and you want to describe that peak. Use it when outliers would distort the mean, since the mode ignores how far values sit from the center.
Do not use the mode as your only summary for numeric data. It throws away most of the information in the dataset. Do not use it when the data are continuous and measured precisely, because exact repeats may be rare and the mode may be meaningless. Do not use it when you need a value that represents the balance point of the data, since that is the mean's job. If you want a quick way to compare all three measures on your own numbers, the Mean, Median & Mode Calculator does the counting for you.
Mode vs Mean and Median
The three measures answer different questions. The mean asks what the balance point is. The median asks what the middle value is. The mode asks what the most common value is.
| Feature | Mode | Mean | Median |
|---|---|---|---|
| Definition | Most frequent value | Sum divided by count | Middle value when sorted |
| Works with categories | Yes | No | No |
| Affected by outliers | No | Yes, strongly | No |
| Can have multiple values | Yes | No | No |
| Uses every observation | No | Yes | Partly |
| Best for | Most common outcome | Symmetric numeric data | Skewed numeric data |
In the shoe example, the mode is 40, the mean is 40.1500, and the median is 40.0000. When a distribution is symmetric and has one clear peak, all three tend to agree. When it is skewed, they separate, and the mode often sits at the tallest bar of the histogram while the mean gets pulled toward the tail.
Common Mistakes
- Reporting the frequency as the mode. The mode is the value, not the count. In the shoe data, the mode is 40, not 7. The fix is to state both clearly: "the mode is size 40, which appears 7 times."
- Assuming every dataset has exactly one mode. Ties are common. If two values share the top frequency, report both as modes and call the dataset bimodal.
- Using the mode on continuous data with few repeats. Heights measured to the millimeter may have no repeated values at all. The fix is to group the data into bins first, then find the modal bin.
- Confusing "no mode" with "mode equals zero." A dataset where every value appears once has no mode. A dataset containing many zeros has a mode of zero. These are different situations.
- Treating the mode as a measure of center for skewed data. The mode can sit far from the middle. The fix is to report the median alongside it when the distribution is skewed.
- Letting software pick silently when there is a tie. Some functions return only one of the tied values 1. The fix is to check the frequency table yourself before trusting a single number.
Limitations
The mode is the least informative of the three averages for numeric data. It uses only the count of each value and ignores the distances between them, so a dataset of [1, 2, 3, 100, 100] has a mode of 100 even though most values are small. It also becomes unstable when the sample is small, since a single extra observation can change which value wins.
For continuous variables, the mode depends heavily on how you round or bin the data. Measure the same heights in centimeters and in inches and you may get different modes. This sensitivity is why the mode is usually reserved for discrete or categorical variables, while the mean and median carry the load for continuous ones. If you need to describe a population rather than a sample, the same logic applies, but the mode becomes a parameter of the underlying distribution 3.
Frequently Asked Questions
What is mode if no value repeats?
If every value in the dataset appears exactly once, there is no mode. Every value ties for the highest frequency of 1, so no single value stands out. Some textbooks say the dataset has no mode, and others say every value is a mode. The first convention is more common.
Can a dataset have more than one mode?
Yes. If two values tie for the highest frequency, the dataset is bimodal and both values are modes. If three or more tie, it is multimodal. This happens often with small samples and with categorical data where several categories are nearly equally popular.
Is the mode the same as the average?
No. The average usually means the mean, which is the sum divided by the count. The mode is the most frequent value. In the shoe example, the mode is 40, the mean is 40.1500, and the median is 40.0000. They can coincide, but they are different measures.
When should I use the mode instead of the mean?
Use the mode when your data are categorical, when you care about the most common outcome, or when outliers would distort the mean. Use the mean when your data are numeric, roughly symmetric, and you want a balance point. Use the median when the data are skewed.
How do I find the mode in Excel or Python?
In Python, statistics.mode returns the most common value, and collections.Counter gives you the full frequency table. In Excel, MODE.SNGL returns the most frequent value for numeric data. For categorical data, build a pivot table or use COUNTIF to count each category, then pick the highest count.
References
Further Reading
- NIST/SEMATECH e-Handbook of Statistical Methods
- OpenStax. Introductory Statistics 2e
- Krzywinski M, Altman N (2013). Importance of being uncertain. Nature Methods
Related Articles
- Parameter Definition in Statistics: Meaning and Examples
- What Is a Stratum? Definition and Examples in Statistics
- What Is a Population in Statistics? Definition and Examples
- What Is an Ordinal Scale? Definition and Examples
- What Is Data? Definition, Meaning and Examples in Science
- What Does Statistical Mean? A Clear Explanation
- Statistical Parameter: Definition, Types, and Estimation