Range Rule of Thumb: Definition, Formula and Examples
By Dr. Zubair Khalid, DVM, MS, PhD ·
The range rule of thumb estimates a standard deviation by dividing the range of a dataset by 4. You then build an interval of mean ± 2 standard deviations, and values outside that interval are treated as unusual. It is a quick mental check, not a substitute for computing the real standard deviation.
Quick Answer
- The formula is $\sigma \approx \dfrac{\text{range}}{4}$, where range = maximum - minimum.
- The rule assumes most values (roughly 95%) fall within 2 standard deviations of the mean [1].
- Unusual values are those below $\text{mean} - 2\sigma$ or above $\text{mean} + 2\sigma$ [1].
- It works best for roughly symmetric, bell-shaped data with no extreme outliers.
- It is an estimate. The true standard deviation can differ noticeably, especially in small or skewed samples [2].
What the Range Rule of Thumb Means
In plain terms, the range rule of thumb says that the spread of a typical dataset is about four standard deviations wide. So if you know the largest and smallest values, you can guess the standard deviation without doing the full calculation.
The precise statistical definition is an approximation: for a roughly normal distribution, almost all observations sit within about 2 standard deviations of the mean on each side, which makes the full width of the data about 4 standard deviations. Dividing the range by 4 recovers an estimate of one standard deviation.
The rule is sometimes written as $\sigma \approx \dfrac{\max - \min}{4}$. The range itself is just the difference between the largest and smallest values.
How It Works
The rule has two stages. First you estimate the standard deviation from the range. Then you use that estimate to define a normal range of values.
$$\sigma \approx \frac{\text{range}}{4} = \frac{\max - \min}{4}$$
Each symbol means:
- $\sigma$ (sigma): the standard deviation, a measure of how spread out values are around the mean.
- $\max$: the largest value in the dataset.
- $\min$: the smallest value in the dataset.
- $\text{range}$: $\max - \min$, the total width of the data.
Once you have $\sigma$, you build the unusual-value bounds:
$$\text{Lower bound} = \bar{x} - 2\sigma \qquad \text{Upper bound} = \bar{x} + 2\sigma$$
Here $\bar{x}$ is the sample mean. Any value below the lower bound or above the upper bound is flagged as unusual [1]. The factor of 2 comes from the empirical rule, which says about 95% of values in a normal distribution fall within 2 standard deviations of the mean [1].
Worked Example
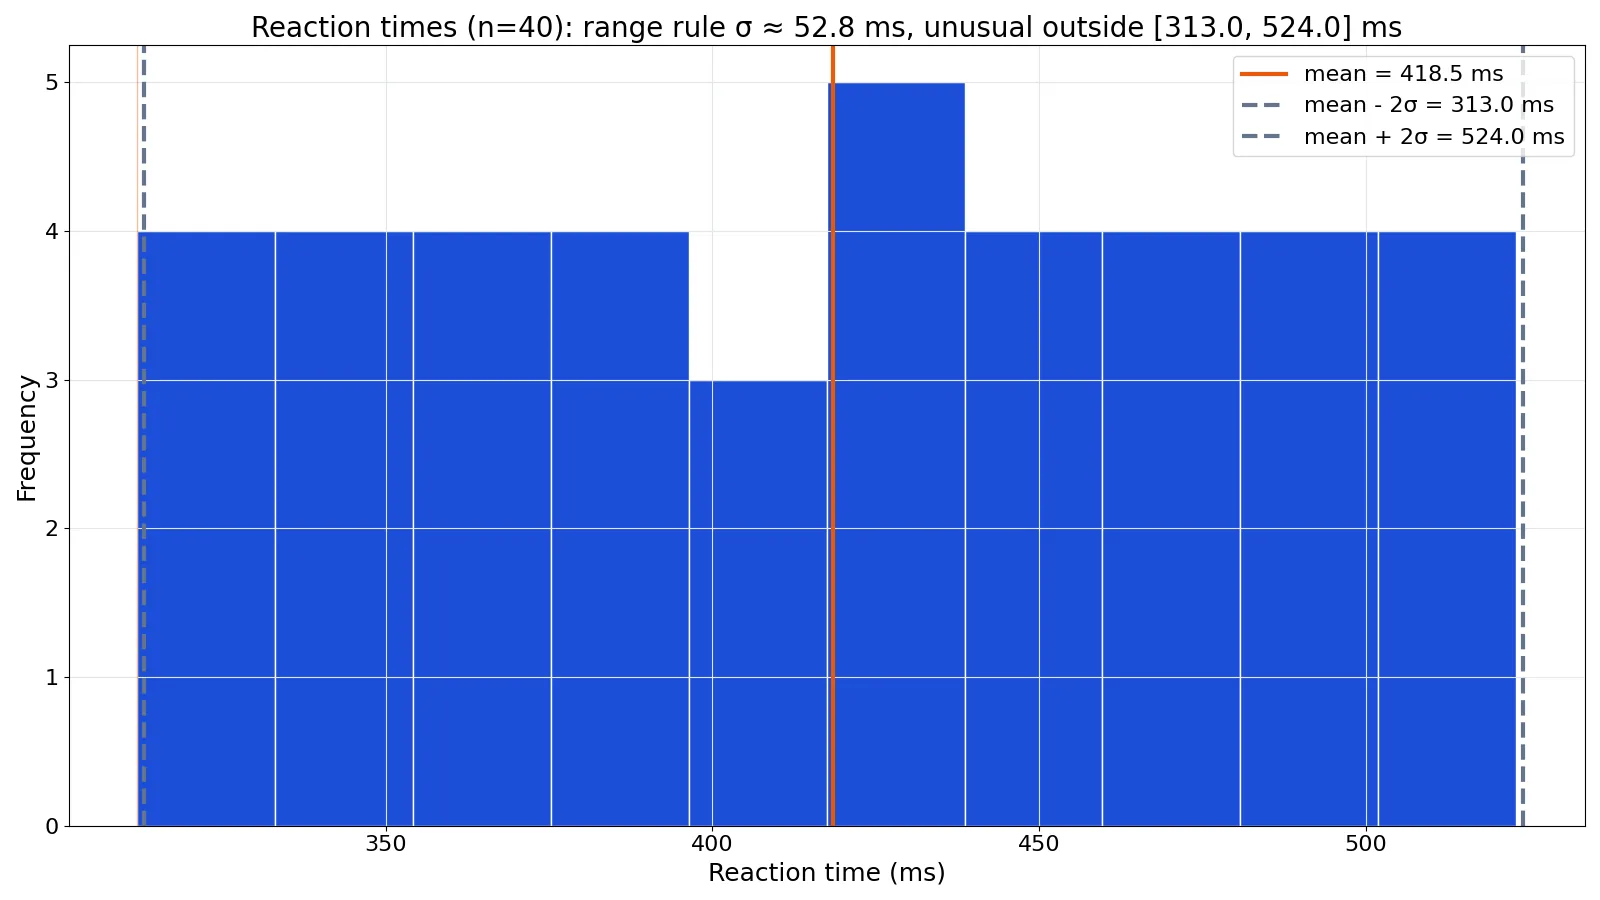
Suppose you recorded 40 reaction times (in milliseconds) from a simple visual task. The fastest response was 312 ms and the slowest was 523 ms.
| reaction_time_ms |
|---|
| 312 |
| 318 |
| 325 |
| 330 |
| 336 |
| 341 |
| 347 |
| 352 |
| 358 |
| 363 |
| 369 |
| 374 |
| 380 |
| 385 |
| 391 |
| 396 |
| 402 |
| 407 |
| 413 |
| 418 |
| 424 |
| 429 |
| 435 |
| 440 |
| 446 |
| 451 |
| 457 |
| 462 |
| 468 |
| 473 |
| 479 |
| 484 |
| 490 |
| 495 |
| 501 |
| 506 |
| 512 |
| 517 |
| 523 |
| 432 |
Step by step:
- Sample size: $n = 40$.
- Minimum: 312 ms. Maximum: 523 ms.
- Range: $523 - 312 = 211$ ms.
- Estimate the standard deviation: $211 / 4 = 52.7500$ ms.
- Sample mean: 418.5250 ms.
- Lower bound: $418.5250 - 2(52.7500) = 313.0250$ ms.
- Upper bound: $418.5250 + 2(52.7500) = 524.0250$ ms.
- Values outside the bounds: 312 ms.
The estimated standard deviation is 52.75 ms, and the unusual-value interval runs from 313.03 ms to 524.03 ms. Only the 312 ms response falls outside it, so it is flagged as unusual.
Here is the same calculation in Python:
import statistics
times = [312, 318, 325, 330, 336, 341, 347, 352, 358, 363, 369, 374, 380, 385, 391, 396, 402, 407, 413, 418, 424, 429, 435, 440, 446, 451, 457, 462, 468, 473, 479, 484, 490, 495, 501, 506, 512, 517, 523, 432]
rng = max(times) - min(times)
sigma = rng / 4
mean = statistics.fmean(times)
lo, hi = mean - 2*sigma, mean + 2*sigma
outliers = [t for t in times if t < lo or t > hi]
print(f"sigma ≈ {sigma:.4f} ms; bounds = [{lo:.4f}, {hi:.4f}] ms; outliers = {outliers}")
Output:
sigma ≈ 52.7500 ms; bounds = [313.0250, 524.0250] ms; outliers = [312]For comparison, the actual sample standard deviation (STDEV.S) is 62.0678 ms. The rule of thumb underestimated it here, which is common when the data are not perfectly bell-shaped [2].
How to Interpret It
The estimated standard deviation tells you the typical distance of a value from the mean. In the example, a typical reaction time sits about 53 ms away from the mean of 418.5 ms.
The interval from mean - 2σ to mean + 2σ is your normal range. Values inside it are considered ordinary. Values outside it are unusual and worth a second look, because under a normal distribution only about 5% of values fall that far out [1].
Treat the flag as a prompt, not a verdict. An unusual value might be a data-entry error, a genuine outlier, or simply a rare but real observation. The rule gives you a fast filter for deciding which values deserve attention.
When to Use It (and when not to)
Use the range rule of thumb when:
- You need a fast, rough estimate of the standard deviation and only have the min and max.
- The data are roughly symmetric and bell-shaped.
- You want a quick screen for unusual values before running a full analysis.
- You are checking a calculation or explaining spread to someone without a calculator.
Do not use it when:
- The data are strongly skewed or have heavy tails.
- There are extreme outliers, since a single outlier inflates the range and distorts the estimate.
- You need a precise standard deviation for a formal test. Compute the real value instead.
- The sample is very small, where the range is unstable.
Range Rule of Thumb vs Standard Deviation Formula
The rule of thumb is an approximation. The standard deviation formula is the exact calculation. The table below compares them.
| Feature | Range rule of thumb | Standard deviation formula |
|---|---|---|
| Input needed | Min and max only | Every value |
| Formula | $\sigma \approx \text{range}/4$ | $\sigma = \sqrt{\dfrac{\sum (x - \bar{x})^2}{n-1}}$ |
| Accuracy | Rough estimate | Exact for the sample |
| Speed | Very fast | Slower |
| Best for | Quick checks, screening | Formal analysis, reporting |
| Sensitive to outliers | Yes, strongly | Yes, but less so |
If you need the exact spread, compute the sample variance and take its square root. The rule of thumb is the shortcut you use when precision is not the priority.
Common Mistakes
- Dividing by 2 instead of 4. The range spans about 4 standard deviations, not 2. Dividing by 2 roughly doubles your estimate. Fix: use range ÷ 4.
- Using the rule on skewed data. Income, waiting times, and similar variables are skewed, so the estimate drifts. Fix: check a histogram first, or compute the real standard deviation.
- Letting one outlier set the range. A single extreme value inflates the range and the estimate. Fix: inspect the min and max before trusting them.
- Confusing the estimate with the true value. The rule gives an approximation, not the sample standard deviation. Fix: label it as an estimate and verify when it matters.
- Applying it to tiny samples. With 5 or 10 values, the range is unstable. Fix: use the full formula for small samples.
- Forgetting the mean. The bounds need the mean, not just the range. Fix: compute the mean before building the interval.
Limitations
The rule of thumb cannot give you a precise standard deviation. It uses only two numbers, the min and max, so it ignores everything in between. Two datasets with the same range can have very different spreads, and the rule will return the same estimate for both [2].
It also assumes a roughly normal shape. When data are skewed, flat or contain outliers, the estimate can be off by a wide margin. The worked example, whose values are spread almost evenly rather than bell-shaped, gave an estimate of 52.75 ms against a true value of 62.07 ms [2]. Use it as a first pass, then confirm with the actual calculation before making decisions.
Frequently Asked Questions
What is the range rule of thumb formula?
The formula is $\sigma \approx \text{range} / 4$, where range is the maximum minus the minimum. It estimates the standard deviation from just two values. You then use mean ± 2σ to identify unusual values [1].
Why do you divide the range by 4?
Because in a roughly normal distribution, almost all values fall within 2 standard deviations of the mean on each side. That makes the full width about 4 standard deviations, so dividing the range by 4 estimates one standard deviation [1].
How do you find unusual values with the range rule of thumb?
Compute the mean, estimate σ as range ÷ 4, then calculate mean - 2σ and mean + 2σ. Any value outside those bounds is considered unusual [1]. In the reaction-time example, only 312 ms fell outside the interval.
Is the range rule of thumb accurate?
It is a rough estimate, not an exact value. It works best for symmetric, bell-shaped data without outliers. For skewed data or small samples, the true standard deviation can differ substantially from the estimate [2].
Can the range rule of thumb be used for any dataset?
No. It assumes a roughly normal shape and no extreme outliers. For skewed distributions or data with heavy tails, compute the standard deviation directly instead of estimating it from the range [2].
References
- 10.2.5: Tech Lab 5 - Statistics LibreTexts/10%3A_Project_Labs_Appendix_and_Tables/10.02%3A_Technology_Labs/10.2.05%3A_Tech_Lab_5)
- [](https://people.math.wisc.edu/~jwrobbin/141dir/propp/S11.html)
Further Reading
- NIST/SEMATECH e-Handbook of Statistical Methods
- OpenStax. Introductory Statistics 2e
- Krzywinski M, Altman N (2013). Importance of being uncertain. Nature Methods
- Krzywinski M, Altman N (2013). Significance, P values and t-tests. Nature Methods
- Wasserstein RL, Lazar NA (2016). The ASA Statement on p -Values: Context, Process, and Purpose. The American Statistician
Related Articles
- Formula for Range: Definition, Formula and Examples
- Covariance Formula: Definition and Calculation Examples
- Mean and Standard Deviation: Definition, Formula and Examples
- t Statistic Formula: Definition, Calculation and Examples
- Binomial Distribution: Formula, Mean and Examples
- Statistical Range: Definition, Calculation, and Applications