Nominal vs Ordinal Variables: Differences and Examples
By Dr. Zubair Khalid, DVM, MS, PhD ·
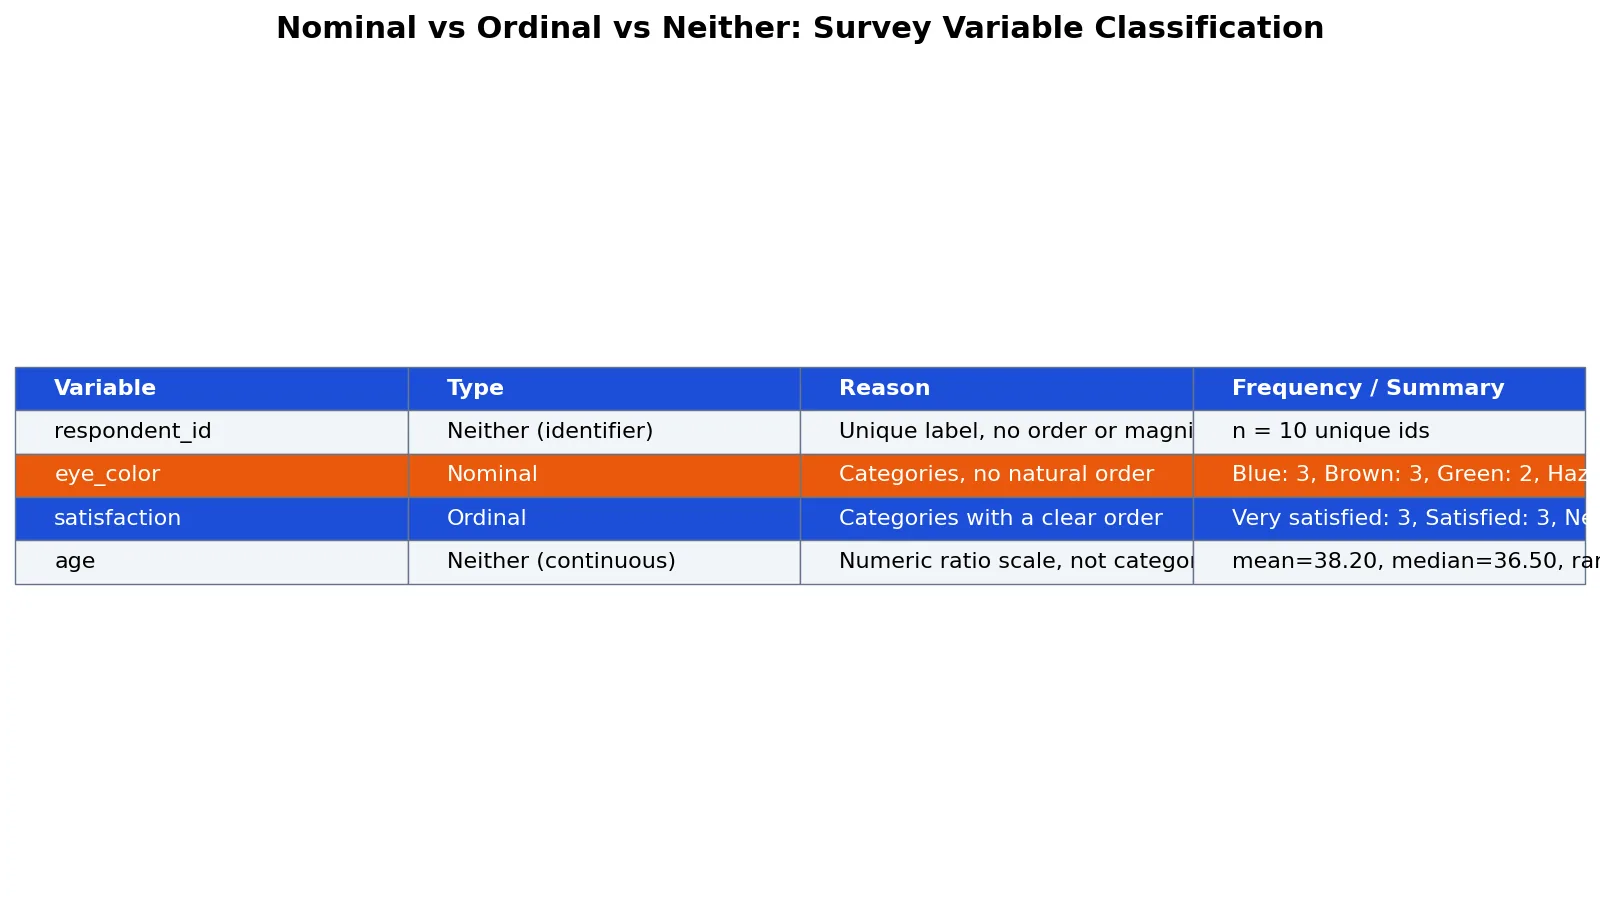
The difference between nominal vs ordinal variables comes down to one question: do the categories have a meaningful order? Nominal variables have categories you can only name, such as eye color or blood type. Ordinal variables have categories you can rank, such as "dissatisfied, neutral, satisfied." Getting this right matters because it determines which statistics and models are valid for your data.
Quick Answer
- Nominal variables have two or more categories with no intrinsic ordering, such as hair color or religion [1].
- Ordinal variables have categories with a clear rank, but the distance between ranks is not guaranteed to be equal [1].
- Age is neither nominal nor ordinal. Measured in years, age is a continuous numeric variable, so you can compute a mean and a median for it.
- Age becomes ordinal only when you bin it into ordered groups such as "18-29," "30-44," "45-59," and "60+."
- The practical test: if you can sort the categories from low to high in a way everyone would agree on, the variable is ordinal. If sorting is arbitrary, it is nominal.
Key Differences
| Property | Nominal | Ordinal |
|---|---|---|
| Category order | None | Meaningful rank |
| Example | Eye color, religion, handedness [2] | Satisfaction level, education level, exposure severity [3] |
| Arithmetic on category codes | Meaningless | Meaningless |
| Valid summary | Counts, mode, proportions | Counts, mode, median, percentiles |
| Typical models | Multinomial logistic regression | Ordinal logistic regression [4] |
| Scale level | Lowest level of measurement [2] | Above nominal, below interval |
Both types are categorical, which means they are measured on either a nominal or an ordinal scale, while numeric variables use interval or ratio scales [5]. The table above shows why the distinction is not cosmetic. Choosing a multinomial model when your outcome is ordered throws away the ranking information, and treating unordered categories as ranked invents information that is not there.
Nominal Variables Explained
A nominal variable simply names or categorizes responses [2]. The essential property is that the categories do not imply any ordering. When you classify people by favorite color, there is no sense in which green is placed ahead of blue [2]. The same logic applies to gender, handedness, and religion [2].
Every observation must fall into exactly one category. The levels of a nominal variable are mutually exclusive, so a person cannot belong to more than one level at once [6].
You can summarize a nominal variable with frequencies and proportions, and you can report the mode. You cannot compute a mean. Assigning numbers to categories, such as Blue = 1 and Brown = 2, is fine for storage, but the average of those codes has no interpretation. For a deeper treatment of this single type, see what a nominal variable is and how to spot one.
Ordinal Variables Explained
An ordinal variable is a qualitative assessment where the relationship among levels is known, but only in terms of rank [6]. Satisfaction ratings, preference rankings, and severity grades all fit this pattern.
The key limitation is spacing. A five-point Likert scale from "strongly agree" to "strongly disagree" is ordinal when you cannot be sure the intervals between the five values are equal [1]. Because the spacing between levels of an ordinal variable is often uneven, the meaning of an average is questionable, and an average requires a variable to be numerical [1].
That is why the median and percentiles are the natural summaries for ordinal data. They depend only on order, not on distance. If you want to go deeper on this type alone, see what an ordinal variable is with examples. Ordinal data sits in the middle of the four scale types, which are covered in levels of measurement: nominal, ordinal, interval and ratio.
Worked Example
Suppose you run a short survey of 10 respondents and record eye color, satisfaction, and age. The raw data look like this.
| respondent_id | eye_color | satisfaction | age |
|---|---|---|---|
| 1 | Blue | Very satisfied | 24 |
| 2 | Brown | Satisfied | 31 |
| 3 | Green | Neutral | 45 |
| 4 | Brown | Satisfied | 29 |
| 5 | Hazel | Dissatisfied | 52 |
| 6 | Blue | Very satisfied | 38 |
| 7 | Brown | Neutral | 41 |
| 8 | Green | Satisfied | 27 |
| 9 | Blue | Dissatisfied | 60 |
| 10 | Hazel | Very satisfied | 35 |
Loading this into pandas gives a table of 10 rows and 4 columns. The classification step is where the nominal vs ordinal distinction does real work.
Step 1: Classify eye_color. It has 4 unordered categories with counts Blue 3, Brown 3, Green 2, Hazel 2. There is no agreed way to rank these, so eye_color is nominal.
Step 2: Classify satisfaction. It has 4 ordered levels with counts Very satisfied 3, Satisfied 3, Neutral 2, Dissatisfied 2. The order runs from best to worst, so satisfaction is ordinal.
Step 3: Classify age. Age is neither. It is continuous numeric, with mean 38.2000, median 36.5000, and a range from 24 to 60.
Step 4: Classify respondent_id. It is neither. It is a unique identifier, not a measurement, even though it looks like a number.
import pandas as pd
df = pd.DataFrame({
    'eye_color': ['Blue','Brown','Green','Brown','Hazel','Blue','Brown','Green','Blue','Hazel'],
    'satisfaction': ['Very satisfied','Satisfied','Neutral','Satisfied','Dissatisfied',
                     'Very satisfied','Neutral','Satisfied','Dissatisfied','Very satisfied'],
    'age': [24,31,45,29,52,38,41,27,60,35],
})
print(df['eye_color'].value_counts().to_dict())
print(df['satisfaction'].value_counts().to_dict())
print(df['age'].mean(), df['age'].median())
Output:
{'Blue': 3, 'Brown': 3, 'Green': 2, 'Hazel': 2}
{'Very satisfied': 3, 'Satisfied': 3, 'Neutral': 2, 'Dissatisfied': 2}
38.2 36.5
Notice that the mean age of 38.2000 sits above the median of 36.5000, which tells you the age distribution is pulled upward by the older respondents. That kind of comparison is available for age and unavailable for satisfaction. You could code satisfaction as 1 through 4 and average it, but the result would depend on an assumption about equal spacing that the scale does not support [1].
Which One Should You Use?
The variable type is a property of how you measured the thing, not a choice you make freely. Still, you sometimes control the measurement.
If you collect satisfaction on a labeled scale, you have an ordinal variable. If you collect it as a 0 to 100 slider, you have something closer to numeric and can justify a mean. If you collapse age into brackets, you have deliberately converted a continuous variable into an ordinal one, which costs you information but can simplify reporting.
For modeling, the outcome type drives the method. When a dependent variable is categorical, ordinary least squares no longer produces the best linear unbiased estimator, so researchers use models built for categorical outcomes instead [4]. Ordered outcomes call for ordinal models, and unordered outcomes call for nominal ones. A study comparing classification trees for occupational exposure estimates, graded as none, low, medium, or high, found that ordinal trees were developed specifically to improve on nominal trees when the target is ordered [3].
If your outcome is numeric, the relevant comparison is a different one, covered in mean vs median and when each is appropriate. And if you are sorting out which variable plays which role in a model, see explanatory variables and their role in regression.
Common Mistakes
- Calling age nominal or ordinal by default. Age in years is continuous numeric. It only becomes ordinal after you bin it into ordered groups. The fix is to check whether the values are counts of units or labels for ranges.
- Averaging ordinal codes. Coding "strongly agree" to "strongly disagree" as 1 to 5 and reporting a mean assumes equal spacing that Likert scales do not guarantee [1]. The fix is to report the median and the full frequency distribution.
- Treating ordinal data as nominal. If your outcome is ordered and you fit a multinomial model, you discard the ranking. The fix is to use an ordinal model when the levels have a natural order [4].
- Treating identifier columns as variables. A respondent ID or zip code stored as a number is not a measurement. The fix is to exclude identifiers from your analysis and from any correlation matrix.
- Assuming a numeric code makes a variable numeric. The numbers attached to categories are labels. The fix is to store categorical columns as strings or pandas category dtype so the type is visible.
- Forgetting that categories must be mutually exclusive. A person cannot belong to more than one level of a nominal variable [6]. The fix is to audit your categories for overlap before collecting data.
Limitations
Classifying a variable does not tell you how it behaves in a sample. Two variables of the same type can have very different distributions, and the choice of descriptive statistics and significance tests depends on distributional characteristics as well as scale type [5]. A nominal variable with 40 sparse categories and one with 2 balanced categories need different treatment.
The nominal versus ordinal line is also blurrier in practice than in textbooks. Many scales sit between ordinal and numeric, and whether you can treat them as interval depends on evidence about spacing that you often do not have [1]. When in doubt, use methods that respect the ordering without assuming equal distances, and report your reasoning so readers can judge it.
Frequently Asked Questions
Is age nominal or ordinal?
Age measured in years is neither. It is a continuous numeric variable, so a mean and a median are both meaningful. Age becomes ordinal only when you group it into ordered brackets such as "18-29" and "30-44," at which point you can rank the brackets but cannot assume the gaps between them are equal.
Is age ordinal or nominal in a survey?
It depends on how the question was asked. If respondents typed a number, you have a numeric variable. If they picked from age ranges, you have an ordinal variable. If they picked from unordered groups, which is rare for age, you would have a nominal variable. Always classify based on the response format, not the topic.
What is the main difference between nominal and ordinal variables?
Nominal categories have no intrinsic ordering, while ordinal categories have a clear rank [1]. Eye color is nominal because there is no agreed way to order the categories [1]. Satisfaction level is ordinal because "very satisfied" ranks above "satisfied." Both are categorical, but only the ordinal one supports a median.
Can you calculate a mean for an ordinal variable?
Not in a way that is generally defensible. An average requires a variable to be numerical, and the spacing between ordinal levels is often uneven, which makes the meaning of the average questionable [1]. Report the median, the mode, and the frequency of each level instead. If you must average, state the equal-spacing assumption explicitly.
How do I know which statistical test to use?
Start with the scale type, then check the distribution. Categorical variables are measured on nominal and ordinal scales, while numeric variables use interval and ratio scales [5]. Distribution characteristics matter because normally and non-normally distributed data call for parametric and nonparametric tests respectively [5]. For ordered outcomes, ordinal regression is the natural starting point [4].
References
- What is the difference between categorical, ordinal and interval variables?
- 1.4: Types of Data and How to Measure Them - Statistics LibreTexts/01%3A_Description/01%3A_Introduction_to_Behavioral_Statistics/1.04%3A_Types_of_Data_and_How_to_Measure_Them)
- Wheeler DC, Archer KJ, Burstyn I, Yu K, Stewart PA, Colt JS, Baris D, Karagas MR (2015). Comparison of ordinal and nominal classification trees to predict ordinal expert-based occupational exposure estimates in a case-control study. The Annals of occupational hygiene
- Regression Models for Ordinal and Nominal Dependent Variables Using SAS, Stata, LIMDEP, and SPSS
- Simundić AM. (2006). (Types of variables and distributions). Acta medica Croatica : casopis Hravatske akademije medicinskih znanosti
- Kinds of Variables
Further Reading
- 1.8: Scales of measurement - Statistics LibreTexts/01%3A_Why_Statistics/1.08%3A_Scales_of_measurement)
Related Articles
- What Is a Nominal Variable? Definition and Examples
- Levels of Measurement: Nominal, Ordinal, Interval and Ratio
- Correlation vs Covariance: Differences and When to Use Each
- Types of Data: Nominal, Ordinal, Interval, Ratio
- Mean vs Median: Differences and When to Use Each
- Predictor vs. Covariate: Clarifying Terminology in Research
- Discrete vs Continuous Variables: Key Differences
- Statistical Synonyms: A Guide to Terminology in Statistics