Interval Scale Questions: Examples and How to Use Them
By Dr. Zubair Khalid, DVM, MS, PhD ·
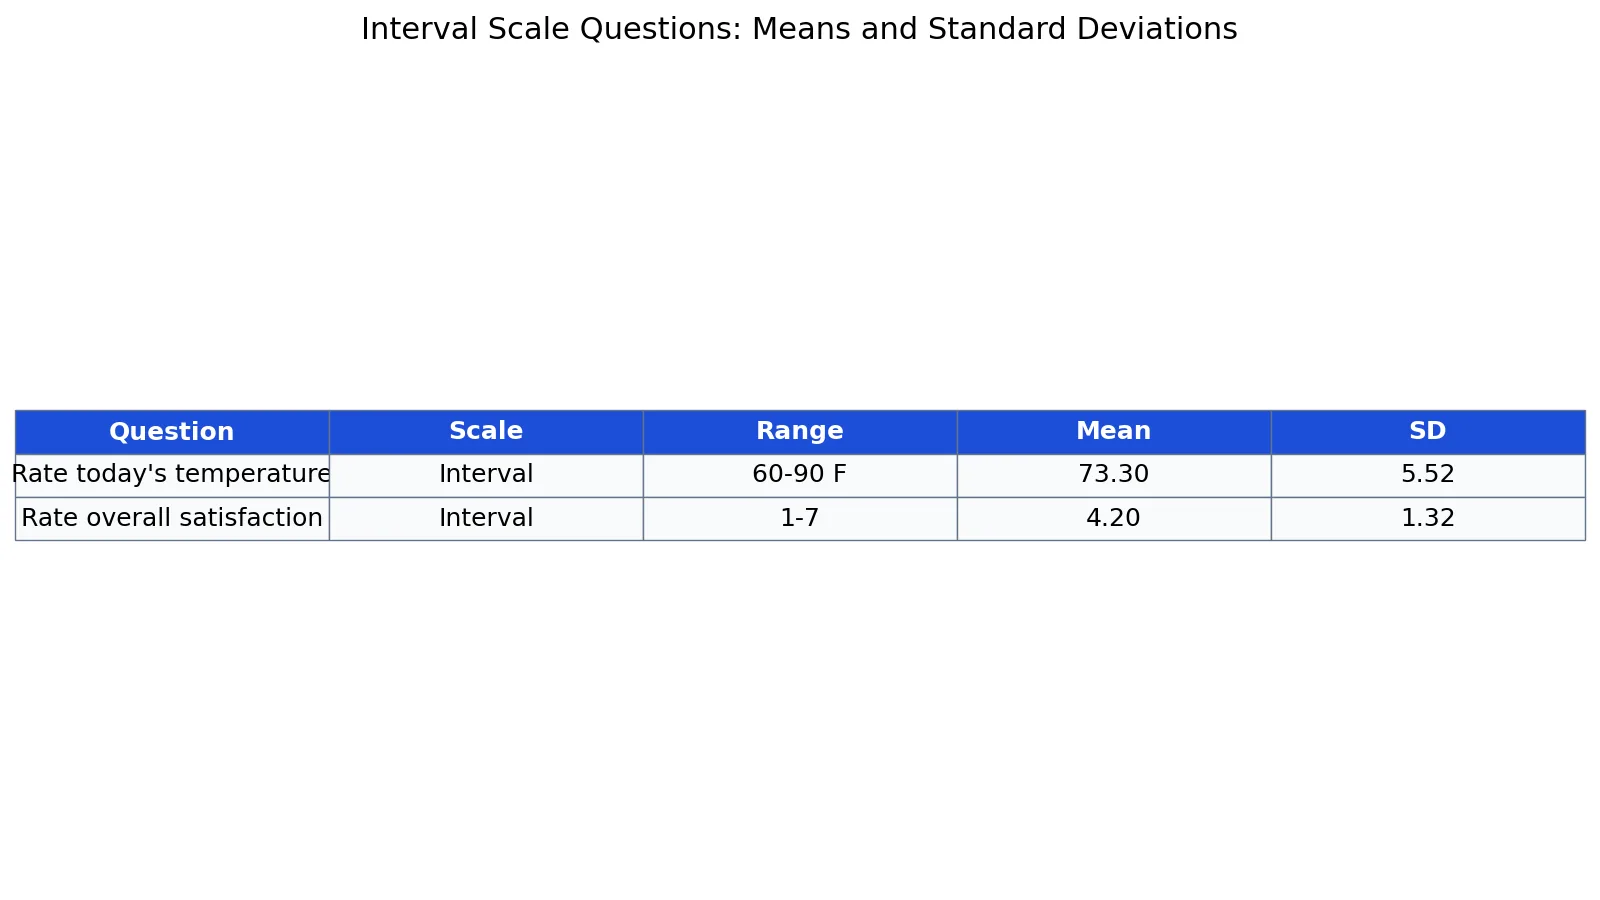
Interval scale questions examples matter because they decide which statistics you can run. An interval scale question asks respondents to place themselves on a scale where the distance between any two adjacent points is equal, so a difference of 1 means the same thing at every point on the scale. This article shows concrete examples, walks through a real dataset, and explains when an interval question is the right choice.
Quick Answer
- Interval scale questions have equal, meaningful distances between answer options, so 2 to 3 equals 8 to 9 in size.
- Classic examples include temperature in Fahrenheit or Celsius, and satisfaction ratings on a labeled 1 to 7 scale.
- You can compute a mean, a standard deviation, and a z-score on interval data because the spacing is uniform [1].
- You cannot say that a score of 6 is "twice as satisfied" as a score of 3, because the scale has no true zero.
- If your scale has a real zero point, such as weight or income, it is a ratio scale, not an interval scale.
What Interval Scale Questions Mean
An interval scale question is a survey or measurement item where the answer options are ordered and the gaps between them are equal in size. If a respondent moves from 3 to 4, the change in the underlying quantity is the same as moving from 8 to 9.
The precise statistical definition is stricter. A variable is measured on an interval scale when it supports the operations of equality and addition of differences, but not multiplication by a constant in a way that preserves meaning. In plain terms, differences are meaningful and ratios are not. Temperature is the standard illustration. The difference between 100 and 90 degrees Fahrenheit is exactly the same as the difference between 42 and 32 degrees [1]. But 80 degrees is not "twice as hot" as 40 degrees, because zero on the Fahrenheit scale is an arbitrary point, not the absence of heat.
This is what separates interval from ordinal. On an ordinal scale you only know that 2 is better than 1, or that 10 is better than 9. You do not know by how much, and the distance between 1 and 2 may be shorter than the distance between 9 and 10 [1]. Interval scales fix that problem by guaranteeing equal spacing. For a broader comparison across all four levels, see levels of measurement: nominal, ordinal, interval and ratio.
How It Works
The mechanism behind interval scales is that equal numeric differences represent equal differences in the construct being measured. That property is what licenses arithmetic on the scores.
The mean of an interval variable is:
$$\bar{x} = \frac{1}{n}\sum_{i=1}^{n} x_i$$
where $\bar{x}$ is the sample mean, $n$ is the number of respondents, and $x_i$ is each individual score. Because the spacing is equal, summing the scores and dividing by $n$ produces a value that sits at a meaningful midpoint.
The sample standard deviation is:
$$s = \sqrt{\frac{\sum_{i=1}^{n}(x_i - \bar{x})^2}{n-1}}$$
where $s$ is the standard deviation, $x_i$ is each score, $\bar{x}$ is the mean, and $n-1$ is the degrees of freedom used for the sample estimate. This measures how spread out the responses are in the original units.
A z-score standardizes a single response:
$$z = \frac{x - \bar{x}}{s}$$
where $z$ is the number of standard deviations a score sits from the mean, $x$ is the raw score, $\bar{x}$ is the mean, and $s$ is the standard deviation. Z-scores only make sense on interval or ratio data, because they depend on subtraction and division of differences.
Worked Example
This example uses a 10-respondent survey with an interval-scale temperature reading in Fahrenheit and a satisfaction rating on a 1 to 7 scale.
| Respondent | Temperature (F) | Satisfaction (1 to 7) |
|---|---|---|
| S01 | 72 | 4 |
| S02 | 68 | 3 |
| S03 | 75 | 5 |
| S04 | 80 | 6 |
| S05 | 65 | 2 |
| S06 | 78 | 5 |
| S07 | 70 | 4 |
| S08 | 82 | 6 |
| S09 | 74 | 4 |
| S10 | 69 | 3 |
Step 1. Sample size: $n = 10$.
Step 2. Temperature sum: $72 + 68 + 75 + 80 + 65 + 78 + 70 + 82 + 74 + 69 = 733$.
Step 3. Temperature mean: $733 / 10 = 73.3000$.
Step 4. Sum of squared deviations: $SS = 274.1000$.
Step 5. Temperature variance: $s^2 = 274.1000 / 9 = 30.4556$.
Step 6. Temperature standard deviation: $s = \sqrt{30.4556} = 5.5187$.
Step 7. Excel check with STDEV.S returns 5.5187, matching the manual calculation.
Step 8. Satisfaction mean: $4.2000$.
Step 9. Satisfaction standard deviation: $s = 1.3166$.
Step 10. Z-score for S01 temperature: $(72 - 73.3000) / 5.5187 = -0.2356$.
Here is the same computation in Python.
import pandas as pd
df = pd.DataFrame({
    "temperature_F": [72, 68, 75, 80, 65, 78, 70, 82, 74, 69],
    "satisfaction_1to7": [4, 3, 5, 6, 2, 5, 4, 6, 4, 3],
})
print(df["temperature_F"].mean())   # 73.3000
print(df["temperature_F"].std(ddof=1))  # 5.5187
print(df["satisfaction_1to7"].mean())   # 4.2000
print(df["satisfaction_1to7"].std(ddof=1))  # 1.3166
Output:
temperature mean = 73.3000
temperature SD = 5.5187
satisfaction mean = 4.2000
satisfaction SD = 1.3166
The temperature mean of 73.30 F and the satisfaction mean of 4.20 are both legitimate because both variables have equal spacing. The temperature SD of 5.52 F tells you the typical distance of a reading from the mean in real degrees. The satisfaction SD of 1.32 scale points tells you the same thing in rating units.
How to Interpret It
Interpret the mean as the balance point of the responses, not as a category label. A satisfaction mean of 4.20 on a 1 to 7 scale means the average respondent sits slightly above the midpoint, assuming the scale is anchored so that 4 is neutral.
Interpret the standard deviation as the typical spread. A temperature SD of 5.52 F means individual readings commonly fall about 5.5 degrees from the mean. A satisfaction SD of 1.32 means responses cluster fairly tightly around the middle.
Interpret z-scores as relative position. The z-score of -0.2356 for S01 means that respondent's temperature sits about a quarter of a standard deviation below the group mean. This is a small deviation, not an outlier.
When you compare groups, compare means and standard deviations together. Two groups can share the same mean but differ sharply in spread, and the SD is what reveals that. If your data are skewed or contain outliers, compare the mean against the median before you report either, as covered in mean vs median: differences and when to use each.
When to Use It (and when not to)
Use an interval scale question when the construct has equal spacing between response options and no meaningful zero. Good cases include temperature, calendar years, standardized test scores, and multi-point satisfaction or agreement scales that have been carefully labeled at every point.
Use it when you plan to compute means, standard deviations, correlations, t-tests, or regression. These procedures assume the spacing between units is uniform, which is exactly what an interval scale provides.
Do not use an interval scale question when the answer options are categories with no order, such as brand names or colors. That is nominal data. Do not use it when the options are ordered but the gaps are clearly unequal, such as income brackets or education levels. Those are ordinal, and the right question format is covered in ordinal survey questions: examples and how to write them.
Do not use an interval scale when a true zero exists and ratios are meaningful. Weight, height, income, and counts are ratio variables. For those, you can say that 40 kg is twice 20 kg, which you cannot do with interval data. See interval data: definition, examples and when to use it for the boundary cases.
Interval vs Ratio Scale
The only structural difference is the zero point. Interval scales have an arbitrary zero, ratio scales have an absolute zero that means "none of the quantity."
| Feature | Interval scale | Ratio scale |
|---|---|---|
| Equal spacing between units | Yes | Yes |
| Meaningful differences | Yes | Yes |
| True zero point | No | Yes |
| Meaningful ratios | No | Yes |
| Mean and SD allowed | Yes | Yes |
| Example | Temperature in F or C | Weight in kg, income in dollars |
| Can you say "twice as much"? | No | Yes |
If you can double a value and the statement still makes sense, you are working with a ratio scale. If doubling produces a nonsense claim, such as "80 F is twice as hot as 40 F," you are working with an interval scale [1].
Common Mistakes
- Treating a 1 to 10 satisfaction scale as ratio data and reporting "respondents were twice as satisfied." Fix: report differences and means, and avoid ratio language on interval data.
- Averaging ordinal data such as income brackets or letter grades. Fix: check the spacing first, and use medians or frequency tables if the gaps are unequal.
- Assuming a labeled scale is automatically interval. Fix: verify that the distance between each pair of adjacent labels is genuinely equal before you run parametric tests.
- Ignoring the arbitrary zero when comparing temperatures. Fix: convert to Kelvin before you make ratio claims about temperature.
- Reporting a mean without a standard deviation. Fix: always pair the mean with the SD so readers can judge spread.
- Dropping the scale anchors from the report. Fix: state what 1 and 7 mean, because the same mean of 4.20 means different things on different anchors.
Limitations
Interval scales cannot support ratio statements. You can say the difference between two scores is 3 points, but you cannot say one score is 50 percent higher than another, because the zero point is arbitrary. This limits how you can phrase findings in reports and dashboards.
Many survey scales that researchers treat as interval, such as 1 to 5 agreement scales, are technically ordinal. Treating them as interval is a common and often defensible practice, but it is an assumption, not a fact, and it can distort results when respondents interpret the middle points unevenly. If the distribution is heavily skewed or the sample is small, prefer nonparametric methods or report the median alongside the mean.
Frequently Asked Questions
What are some interval scale questions examples I can use in a survey?
Common examples include "Rate your satisfaction from 1 to 7," "What is the current temperature in your workspace in Fahrenheit," and "On a scale from 0 to 100, how likely are you to recommend us." Each has equal spacing between points and no true zero.
Can I calculate an average from interval scale questions?
Yes. Because the spacing is equal, the mean is a valid summary. In the worked example, the temperature mean was 73.3000 F and the satisfaction mean was 4.2000 on a 1 to 7 scale. You can also compute the standard deviation and z-scores.
Is a Likert scale an interval or ordinal scale?
A single Likert item is technically ordinal. A Likert scale that sums several items into a composite score is often treated as interval because the sum of many ordered items tends to behave like an interval variable. The safest approach is to report both the mean and the median.
What is the difference between interval and ratio scale questions?
Interval scales have equal spacing but an arbitrary zero, so ratios are meaningless. Ratio scales have equal spacing and a true zero, so ratios are meaningful. Temperature in Celsius is interval, temperature in Kelvin is ratio.
How do I know if my survey question is interval scale?
Check two things. First, the answer options must be ordered. Second, the distance between each pair of adjacent options must be equal. If both hold and there is no true zero, you have an interval scale question. If the gaps are unequal, it is ordinal.
References
Further Reading
- Krzywinski M, Altman N (2013). Importance of being uncertain. Nature Methods
- NIST/SEMATECH e-Handbook of Statistical Methods
- Ioannidis JPA (2005). Why Most Published Research Findings Are False. PLoS Medicine
- OpenStax. Introductory Statistics 2e
- Krzywinski M, Altman N (2013). Significance, P values and t-tests. Nature Methods
Related Articles
- Interval Data: Definition, Examples and When to Use It
- Ordinal Survey Questions: Examples and How to Write Them
- Levels of Measurement: Nominal, Ordinal, Interval and Ratio
- Mean of Interval: How to Find the Midpoint and Average
- Pie Chart Examples: When They Work and When They Mislead
- Statistical Questions Examples: How to Write Them
- Statistical Questions: How to Identify and Formulate Them
- How to Report Measurement Uncertainty in Test Reports: A Template and Examples