What Is a Nominal Variable? Definition and Examples
By Dr. Zubair Khalid, DVM, MS, PhD ·
Nominal data is a type of categorical data in which values are labels for unordered groups. Blood type, marital status and country of birth are all nominal variables because no category ranks above another. You can count and compare these categories, but you cannot average them or say one is "more" than another.
Quick Answer
- A nominal variable places each case into one of a set of categories that have no natural order [1].
- The categories are qualitative labels, not quantities, so arithmetic on the codes is meaningless [1].
- Nominal variables are also called categorical or factor-type variables [2].
- The only summary statistics that make sense are counts, percentages and the mode.
- Typical examples include blood type, race, marital status, biological sex and transport mode [2].
What a Nominal Variable Means
In plain terms, a nominal variable answers the question "which group does this case belong to?" The answer is a name or label. A participant's blood type might be A, B, AB or O. A commuter's usual transport might be car, bus, bike or train. Nothing about the label implies more or less of anything.
The precise statistical definition is narrower. A nominal measurement is one that can take on any element in a finite set of unordered values [2]. That definition has two parts. The set is finite, so there is a fixed list of allowed categories. The values are unordered, so no category is greater than or less than another [2]. This places nominal data at the weakest of the four levels of measurement, below ordinal, interval and ratio data. If you want the full ladder, see levels of measurement: nominal, ordinal, interval and ratio.
Nominal variables often arise in research involving human subjects. Common examples include race, national origin, biological sex, marital status and immigration status [2]. These are broadly called demographic traits [2]. The same structure appears outside demographics. A cancer study might record tumor type, and a marketing survey might record which brand a household buys. In every case the categories are names, not scores.
One practical detail matters for analysis. Software often stores nominal categories as numbers, so "Car" becomes 1, "Bus" becomes 2 and so on. Those numbers are codes, not measurements. Computing a mean code of 1.7 tells you nothing about transport.
How It Works
There is no formula that produces a nominal value. The mechanism is classification. You define a finite set of categories, then assign each case to exactly one of them.
The summary statistics follow from that structure. For a nominal variable with $k$ categories, the count for category $i$ is the number of cases assigned to it:
$$n_i = \sum_{j=1}^{N} I(x_j = c_i)$$
Here $N$ is the total number of cases, $x_j$ is the category recorded for case $j$, $c_i$ is the $i$-th category label, and $I(\cdot)$ is an indicator that equals 1 when the case belongs to that category and 0 otherwise. Summing the indicator across all cases gives the count.
The relative frequency, or percentage, divides that count by the total:
$$p_i = \frac{n_i}{N} \times 100$$
The mode is the category with the largest count. If two or more categories tie for the largest count, the distribution is multimodal and you should report all tied categories. Because the categories are unordered, the order in which you list them is a presentation choice, not a property of the data.
Worked Example
A survey of 30 participants recorded each person's blood type and favorite transport mode. Both variables are nominal. Here is the dataset.
| participant_id | blood_type | transport |
|---|---|---|
| 1 | A | Car |
| 2 | B | Bus |
| 3 | AB | Bike |
| 4 | O | Car |
| 5 | A | Bus |
| 6 | O | Train |
| 7 | B | Car |
| 8 | A | Bike |
| 9 | O | Bus |
| 10 | AB | Car |
| 11 | A | Train |
| 12 | B | Car |
| 13 | O | Bus |
| 14 | A | Bike |
| 15 | O | Car |
| 16 | B | Bus |
| 17 | A | Train |
| 18 | AB | Car |
| 19 | O | Bike |
| 20 | A | Bus |
| 21 | B | Car |
| 22 | O | Train |
| 23 | A | Bus |
| 24 | O | Car |
| 25 | B | Bike |
| 26 | A | Bus |
| 27 | O | Car |
| 28 | AB | Train |
| 29 | A | Bus |
| 30 | O | Car |
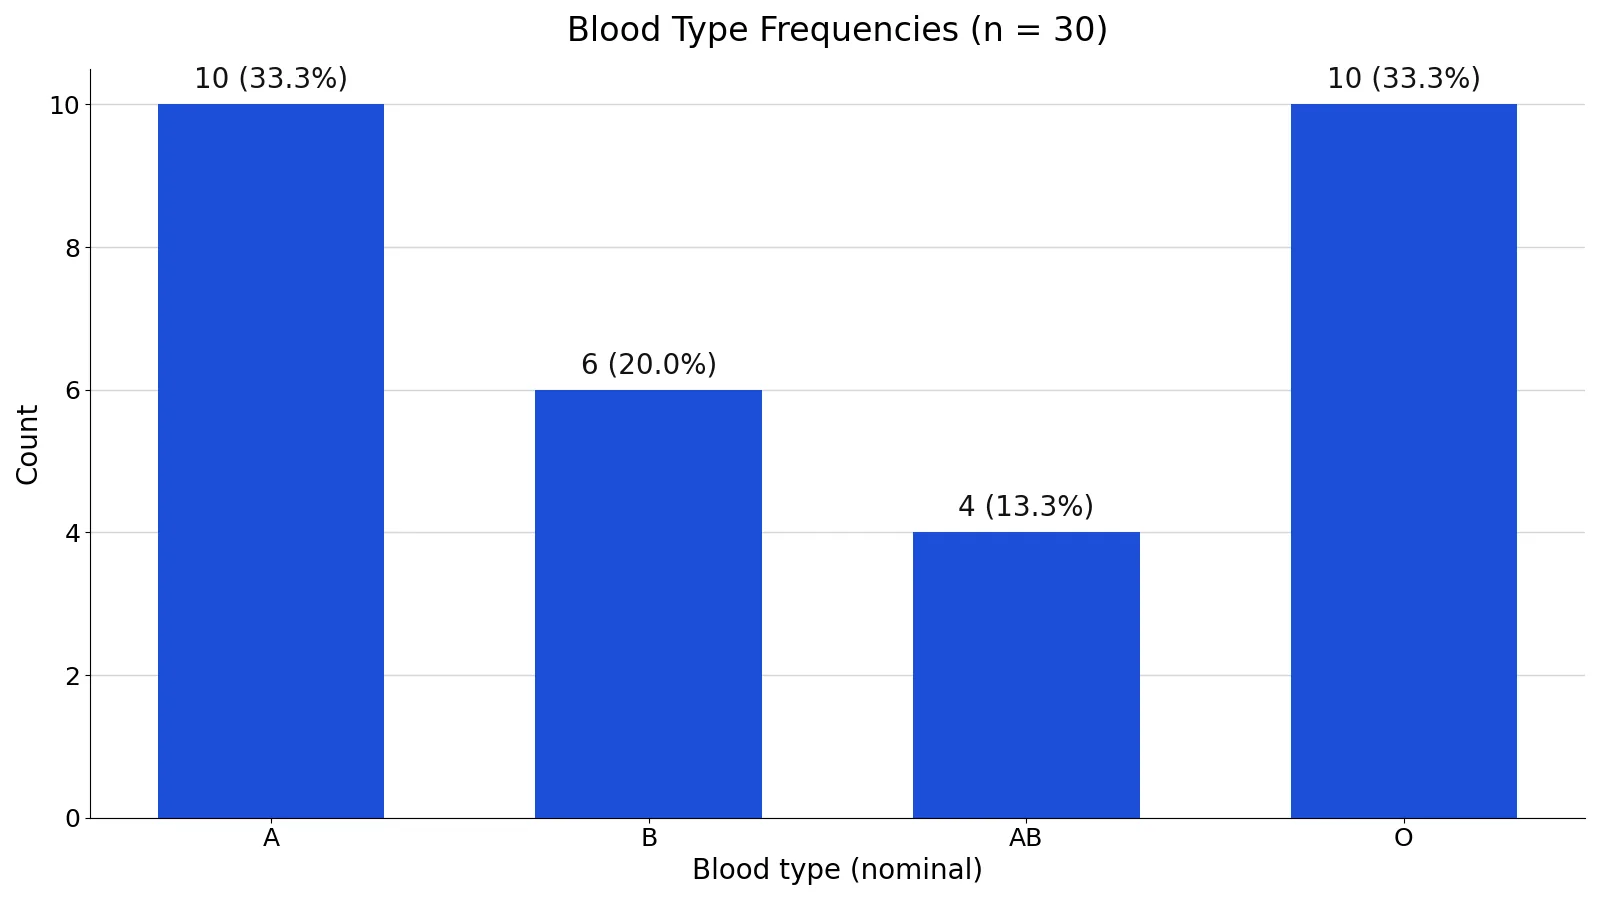
The total is $n = 30$. Counting each blood type gives A = 10, B = 6, AB = 4 and O = 10. Converting to percentages:
- A: $10/30 = 0.3333$, or 33.3%
- B: $6/30 = 0.2000$, or 20.0%
- AB: $4/30 = 0.1333$, or 13.3%
- O: $10/30 = 0.3333$, or 33.3%
The percentages sum to 99.9% because of rounding. The mode is A, with a count of 10, and O ties it at 10, so this distribution is bimodal. For transport, the counts are Car = 11, Bus = 9, Bike = 5 and Train = 5.
You can reproduce the blood type table in Python.
import pandas as pd
df = pd.DataFrame({'blood_type': ['A', 'B', 'AB', 'O', 'A', 'O', 'B', 'A', 'O', 'AB', 'A', 'B', 'O', 'A', 'O', 'B', 'A', 'AB', 'O', 'A', 'B', 'O', 'A', 'O', 'B', 'A', 'O', 'AB', 'A', 'O']})
vc = df['blood_type'].value_counts()
pct = (vc / len(df) * 100).round(1)
print(pd.DataFrame({'count': vc, 'percent': pct}))
Output:
            count  percent
blood_type
A              10     33.3
O              10     33.3
B               6     20.0
AB              4     13.3
A bar chart of these frequencies, with each bar labeled by its count and percentage, is the standard way to display a nominal distribution. Bar order is arbitrary, so sort by frequency or by a logical grouping, whichever reads better.
How to Interpret It
Read a nominal distribution as a set of shares. Saying "33.3% of participants have blood type A" is meaningful. Saying "the average blood type is 1.5" is not, even if the software returns that number.
The mode is the only measure of central tendency available. Spread has no numeric meaning either, so you report the number of categories and how evenly cases are distributed across them. A variable with one dominant category behaves differently in later analysis than one spread evenly across four categories.
When you compare nominal variables across groups, compare the full set of percentages, not a single number. In the example, blood type A and O are equally common at 33.3% each, while AB is the least common at 13.3%. That pattern is the finding.
When to Use It (and when not to)
Use a nominal variable when the categories are names with no ranking and you want to describe group membership or compare group frequencies. This covers demographic breakdowns, survey responses with unordered options, and classification labels such as diagnosis type or product category.
Do not treat a nominal variable as numeric. Do not compute means, standard deviations or correlations on the category codes. Do not assume the categories are equally spaced or that one is "higher" than another.
If the categories do have a natural order, you have an ordinal variable instead. Education level and satisfaction ratings are ordinal, because the categories rank from low to high. The distinction changes which statistics are valid, and it is covered in nominal vs ordinal variables: differences and examples. If the values are true quantities with meaningful differences, such as age or income, you have numeric data and the full set of summary statistics applies. See quantitative data examples: definition and types for that case.
Nominal vs Ordinal
The closest related idea is the ordinal variable. Both are categorical, and both are summarized with counts and percentages. The difference is whether the categories have a natural order.
| Feature | Nominal | Ordinal |
|---|---|---|
| Category order | None | Natural ranking exists |
| Example | Blood type, transport mode | Education level, satisfaction rating |
| Mode | Valid | Valid |
| Median | Not meaningful | Often meaningful |
| Mean of codes | Not meaningful | Usually not meaningful |
| Typical display | Bar chart sorted by frequency | Bar chart in rank order |
The practical test is simple. Ask whether one category is genuinely higher or better than another. If the answer is no, the variable is nominal. If the answer is yes, it is ordinal.
Common Mistakes
- Averaging category codes. Assigning 1 to Car and 2 to Bus and reporting a mean of 1.7 produces a number with no interpretation. Fix: report counts and percentages instead.
- Treating the code order as a ranking. The fact that AB is coded 3 and A is coded 1 does not make AB "more" than A. Fix: check whether the categories have a real order before choosing statistics.
- Dropping the "Other" or "Prefer not to answer" category. These are legitimate nominal categories and removing them changes every percentage. Fix: report them, or state clearly that you excluded them and why.
- Reporting percentages without the base. "33.3% have blood type A" means nothing without knowing whether the total is 30 or 3,000. Fix: always give the count alongside the percentage.
- Forcing a bar chart into rank order. Sorting nominal bars from largest to smallest is fine for readability, but labeling the axis as if it were a scale is misleading. Fix: keep the axis categorical and note that order is presentational.
- Ignoring rare categories. A category with 2 cases out of 500 can still matter, and it will distort any model that treats it as a level. Fix: decide in advance how to handle rare levels and document the rule.
Limitations
Nominal data carries the least information of the four measurement levels. You cannot measure distance between categories, so you cannot compute differences, averages or standard deviations. Any statistic that requires arithmetic on the values is off limits.
The categories themselves are also a human choice. How you define and label them shapes the results, and different coding schemes for the same underlying concept can produce different distributions. A variable with many categories becomes hard to summarize and hard to model, since each level needs enough cases to support a stable estimate. When you move to modeling, a nominal predictor is typically encoded into indicator variables, and the reference category you choose changes how the coefficients read. That topic connects to explanatory variable: definition, examples and role in regression and to bivariate data: definition, examples and analysis when you cross two categorical variables.
Frequently Asked Questions
What is nominal data in simple terms?
Nominal data is information that sorts things into named groups with no order. Blood type, eye color and country of birth are examples. You can count how many cases fall in each group, but you cannot rank the groups or average them.
What is the difference between nominal and ordinal data?
Ordinal data has a natural order, nominal data does not. Satisfaction ratings from "very dissatisfied" to "very satisfied" are ordinal because the categories rank. Blood type is nominal because no type is higher than another. Both are summarized with counts and percentages, but ordinal data also supports a median.
Can you calculate a mean for nominal data?
No. A mean requires values that can be added and divided, and nominal categories are labels. If your software returns a mean for a coded nominal variable, that number is an artifact of the coding scheme and has no substantive meaning.
What statistics should I report for a nominal variable?
Report the count and percentage for each category, the total number of cases, and the mode. If two categories tie for the highest count, report both. A bar chart is the standard visual, with bars labeled by count and percentage.
Is gender a nominal variable?
Biological sex and gender identity are usually treated as nominal variables because the categories have no inherent ranking. The specific categories depend on how the question was asked and coded, and that coding should be reported alongside the results.
References
- Nominal Data - Statistics - explanations and formulas - Research Guides at University of North Dakota
- Types of Data | Introduction to Data Science
Further Reading
- NIST/SEMATECH e-Handbook of Statistical Methods
- OpenStax. Introductory Statistics 2e
- Krzywinski M, Altman N (2013). Importance of being uncertain. Nature Methods
- Krzywinski M, Altman N (2013). Significance, P values and t-tests. Nature Methods
Related Articles
- Nominal vs Ordinal Variables: Differences and Examples
- Types of Data: Nominal, Ordinal, Interval, Ratio
- Explanatory Variable: Definition, Examples and Role in Regression
- What Is an Independent Variable? Definition and Examples
- Dependent Variable Examples: Definition and Study Design
- Predictor vs. Covariate: Clarifying Terminology in Research