How to Calculate Class Width (Formula and Examples)
By Dr. Zubair Khalid, DVM, MS, PhD ·
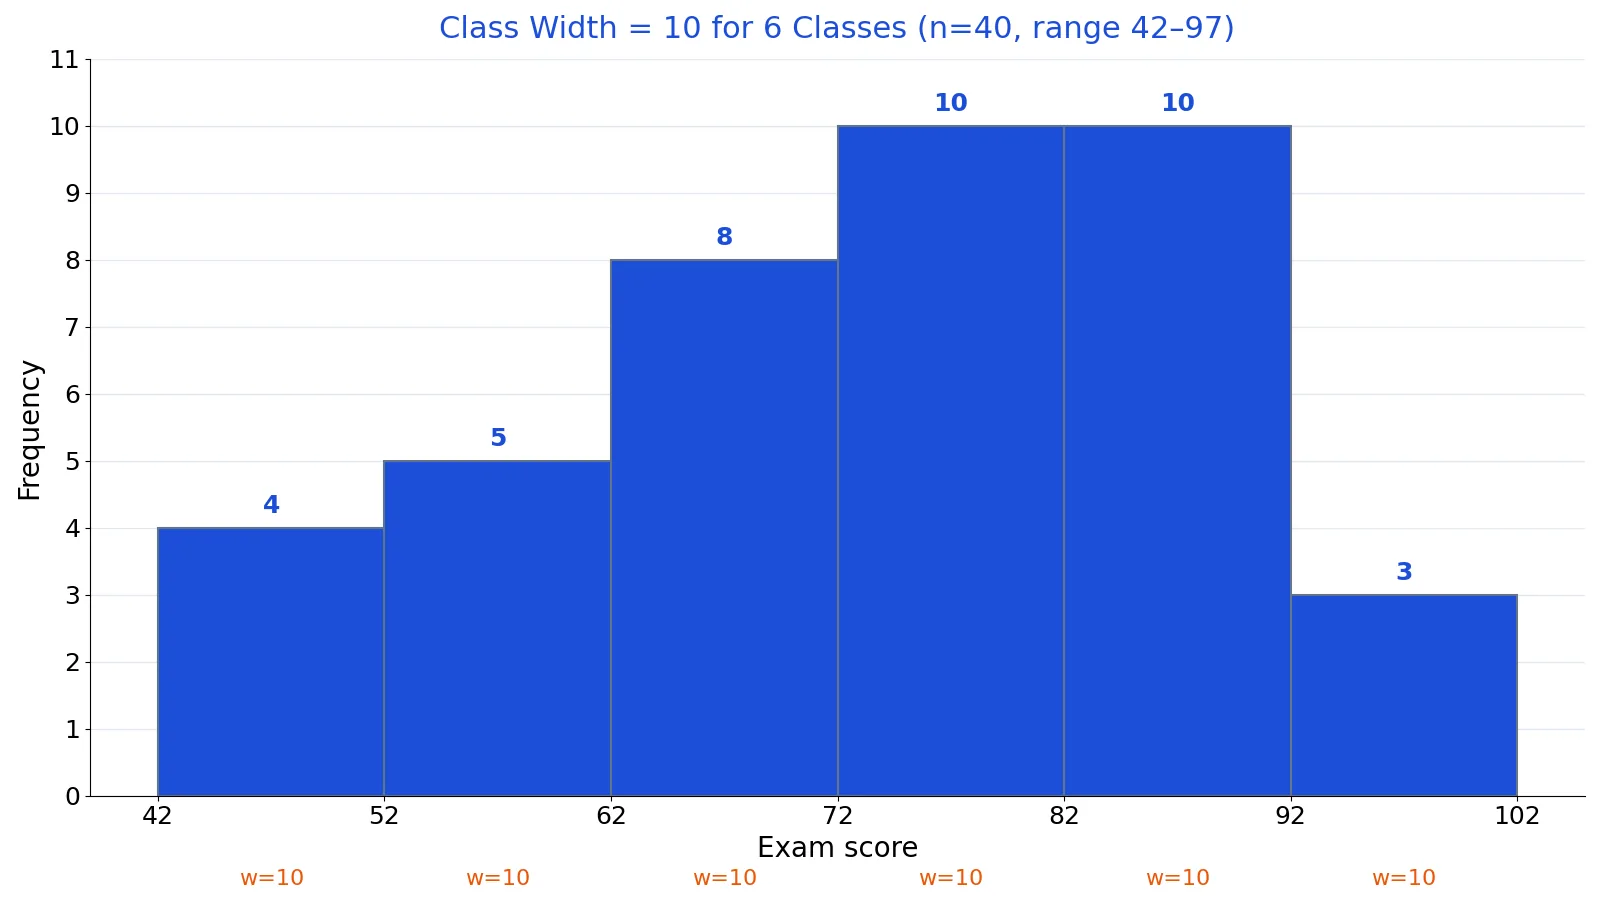
To calculate class width, subtract the smallest value in your data from the largest, divide by the number of classes you want, then round the result up to the next whole number. That rounded value is the width of every class in your grouped frequency table. This article shows the formula, a full worked example with 40 exam scores, and the mistakes that throw the answer off.
Quick Answer
- Formula: $\text{Class width} = \dfrac{\text{maximum} - \text{minimum}}{\text{number of classes}}$, then round up.
- Always round up, never down. Rounding down can leave the largest value outside the last class.
- The number of classes is your choice, but grouped frequency tables usually use between 5 and 20 classes [1].
- Every class must have the same width, so the table stays consistent [1].
- Example: scores from 42 to 97 in 6 classes give $(97 - 42) / 6 = 9.1667$, which rounds up to a class width of 10.
Before You Start
You need three things before you can find class width: the minimum value, the maximum value, and the number of classes you plan to use.
The minimum and maximum come straight from your raw data. Sort the values or use MIN and MAX functions, and write both numbers down. Do not estimate them by eye, because a single missed value changes the width.
The number of classes is a judgment call. A common starting point is Sturges' rule, $k = 1 + 3.322 \log_{10}(n)$, where $n$ is the number of data values. For 40 values that gives about 6.3, so 6 classes is a reasonable choice. You can also simply pick a number between 5 and 20, which is the range most textbooks recommend [1].
One more decision matters: whether your classes are defined by limits or by boundaries. Limits are the values you write in the table, such as 42 to 51. Boundaries sit half a unit outside the limits, such as 41.5 to 51.5, and they make the classes continuous so no value falls between two classes [1]. The width is the same either way, so pick one convention and stay with it.
Step by Step
- Find the minimum. Identify the smallest value in the dataset. Call it $\text{min}$.
- Find the maximum. Identify the largest value. Call it $\text{max}$.
- Choose the number of classes. Call it $k$. Use Sturges' rule or pick a value between 5 and 20 [1].
- Apply the formula. Compute the raw width:
$$\text{Raw width} = \frac{\text{max} - \text{min}}{k}$$
- Round up. Take the ceiling of the raw width. If the raw width is already a whole number, keep it as is. Rounding up guarantees the classes cover the full range.
- Build the class limits. Start at $\text{min}$ and add the width repeatedly until you pass $\text{max}$. The starting point is the lower limit of the first class, and adding the width gives each next lower limit [1].
- Find the upper limits. Subtract one unit from the lower limit of the next class to get the upper limit of the current class [1]. If your data has decimals, subtract one unit of the smallest decimal place instead.
- Count the frequencies. Tally how many values fall in each class. Check that the counts add up to $n$.
Worked Example
The dataset is 40 exam scores from a class test, ranging from 42 to 97.
| Score | |||||||||
|---|---|---|---|---|---|---|---|---|---|
| 42 | 45 | 48 | 51 | 53 | 55 | 57 | 58 | 60 | 62 |
| 63 | 65 | 66 | 68 | 69 | 70 | 71 | 72 | 73 | 74 |
| 75 | 76 | 77 | 78 | 79 | 80 | 81 | 82 | 83 | 84 |
| 85 | 86 | 87 | 88 | 89 | 90 | 91 | 92 | 94 | 97 |
Step 1. Count the values. There are 40 scores, so $n = 40$.
Step 2. Find the minimum. The lowest score is 42.
Step 3. Find the maximum. The highest score is 97.
Step 4. Choose the number of classes. Sturges' rule gives $1 + 3.322 \log_{10}(40) \approx 6.3$, so use $k = 6$.
Step 5. Compute the raw width.
$$\frac{97 - 42}{6} = \frac{55}{6} = 9.1667$$
Step 6. Round up. $\lceil 9.1667 \rceil = 10$. The class width is 10.
Step 7. Build the bins. Starting at 42 and adding 10 each time gives the bin edges 42, 52, 62, 72, 82, 92, 102. The last edge, 102, sits above the maximum of 97, which is what you want.
Step 8. Count the frequencies. Tallying the scores into those bins gives 4, 5, 8, 10, 10, and 3. The counts sum to 40, matching $n$.
| Class | Frequency |
|---|---|
| 42 to 51 | 4 |
| 52 to 61 | 5 |
| 62 to 71 | 8 |
| 72 to 81 | 10 |
| 82 to 91 | 10 |
| 92 to 101 | 3 |
| Total | 40 |
Here is the same calculation in Python.
import numpy as np, math
scores = np.array([...])  # 40 exam scores
mn, mx, k = scores.min(), scores.max(), 6
width = math.ceil((mx - mn) / k)
bins = [mn + i*width for i in range(k+1)]
counts, edges = np.histogram(scores, bins=bins)
Output:
width = 10, bins = [42, 52, 62, 72, 82, 92, 102], counts = [4, 5, 8, 10, 10, 3]In Excel, with the 40 scores in cells A2 through A41, the same result comes from:
=CEILING.MATH((MAX(A2:A41)-MIN(A2:A41))/6, 1)That formula returns 10.
Other Ways to Do It
Sturges' rule for the class count. If you do not want to pick $k$ by hand, compute $k = 1 + 3.322 \log_{10}(n)$ and round to a whole number. It works well for roughly symmetric data and tends to give too few classes, over-smoothing, for large datasets.
The square root rule. Another common choice is $k = \sqrt{n}$. For 40 values that gives about 6.3, so 6 classes again. It is quick and easy to remember.
Rice's rule. $k = 2\sqrt[3]{n}$ gives a slightly larger class count for big datasets. For 40 values it gives about 6.8, so 7 classes.
Software defaults. Spreadsheet histogram tools and Python's numpy.histogram will pick bins for you if you do not supply edges. Those defaults are convenient but they do not always produce round, readable class limits, so check the output before you publish it.
Whichever route you take, the width formula itself does not change. Only the value of $k$ changes.
Troubleshooting
The last class does not reach the maximum. You rounded the width down, or you used too few classes. Round up and rebuild the bins.
A value falls exactly on a bin edge. With bin edges 42, 52 and 62, a score of 52 sits exactly on the edge between the first two bins. Using boundaries of 41.5 to 51.5 and 51.5 to 61.5 removes the ambiguity, because each value sits clearly inside one class [1].
The frequencies do not sum to n. You either missed a value or double-counted one at a boundary. Recount with the boundary convention in mind.
The width is a fraction like 9.17. That is the raw width. Round it up to 10 before you build the table. Fractional widths make the limits hard to read and are rarely used in published tables.
You have empty classes. Keep them. Classes with no values still belong in the table unless they are the first or last class, which you can drop [1].
Common Mistakes
- Rounding down instead of up. Rounding 9.1667 down to 9 leaves the top score of 97 outside the last class. Always take the ceiling.
- Using the range as the width. The range is 55. The width is 10. They are different numbers and mixing them up produces a table with one giant class.
- Forgetting the half-unit shift when converting between limits and boundaries. Boundaries sit half a unit outside the limits, so 42 to 51 becomes 41.5 to 51.5 [1]. Skipping this step creates gaps between classes.
- Letting classes overlap. If one class ends at 51 and the next starts at 51, the value 51 has two homes. Classes must be mutually exclusive [1].
- Using unequal widths. Every class should be the same width, with the possible exception of an open first or last class such as "below 42" [1]. Unequal widths make the histogram misleading.
- Choosing k after seeing the answer you want. Pick the number of classes first, then compute the width. Working backward to force a preferred table is a form of cherry-picking.
Limitations
Class width is a presentation choice, not a property of the data. Two analysts can look at the same 40 scores and produce tables with 5, 6, or 8 classes, and all of them can be correct. The histogram shape changes with the width, so a distribution that looks bimodal at width 10 might look smooth at width 15. Report the number of classes and the width alongside any histogram so readers can judge the choice.
The formula also assumes you want equal-width classes covering the full range. Real data sometimes needs an open-ended first or last class, such as ages grouped as "under 18" or "65 and above" [1]. Those classes have no defined width, so the formula applies only to the closed classes in the middle. Finally, the width tells you nothing about the underlying distribution. It only tells you how the values were grouped.
Frequently Asked Questions
What is the formula for class width?
$$\text{Class width} = \left\lceil \frac{\text{maximum} - \text{minimum}}{\text{number of classes}} \right\rceil$$
Subtract the minimum from the maximum, divide by the number of classes, then round up to the next whole number. The ceiling brackets mean round up, not round to nearest.
How do I find class width if the answer is a whole number?
Keep it. If $(97 - 42) / 5 = 11$ exactly, the class width is 11. Rounding up only changes the value when the division leaves a remainder.
How many classes should I use?
Most grouped frequency tables use between 5 and 20 classes [1]. Sturges' rule, $1 + 3.322 \log_{10}(n)$, and the square root rule, $\sqrt{n}$, are common ways to pick a number. For 40 values, both point to about 6 classes.
Can class width be a decimal?
It can, but it usually should not be. A width of 9.1667 produces limits like 42, 51.1667, 60.3333, which are hard to read and hard to tally. Round up to a whole number unless your data is measured in decimals and you have a reason to keep the fraction.
What is the difference between class width and class interval?
People often use the two terms interchangeably. Strictly, the class interval is the range of values covered by one class, and the class width is its size. With limits of 42 to 51, the interval is 42 through 51 and the width is 10, counting both endpoints.
Does class width change if I use boundaries instead of limits?
No. Boundaries shift the endpoints by half a unit but do not change the distance between them. A class with limits 42 to 51 and a class with boundaries 41.5 to 51.5 both have a width of 10 [1].
References
Further Reading
- NIST/SEMATECH e-Handbook of Statistical Methods
- OpenStax. Introductory Statistics 2e
- Krzywinski M, Altman N (2013). Importance of being uncertain. Nature Methods
- Krzywinski M, Altman N (2013). Significance, P values and t-tests. Nature Methods
- Wasserstein RL, Lazar NA (2016). The ASA Statement on p -Values: Context, Process, and Purpose. The American Statistician