Euclidean Distance: Definition, Formula and Examples
By Dr. Zubair Khalid, DVM, MS, PhD ·
Euclidean distance is the straight-line distance between two points. It is the most familiar way to measure how far apart two observations are, and it is the default distance metric in many machine learning algorithms. This article gives you the formula, a full worked example, and the practical rules for using it well.
Quick Answer
- Euclidean distance is the length of the straight line connecting two points in space [1].
- For two points $A = (a_1, a_2, \dots, a_n)$ and $B = (b_1, b_2, \dots, b_n)$, the formula is $\sqrt{\sum_{i=1}^{n}(a_i - b_i)^2}$.
- In one dimension it reduces to the absolute difference between two values [1].
- It is a true metric, so it is symmetric, is zero only for identical points, and obeys the triangle inequality [2].
- In machine learning it is often called L2 distance and is used in k-nearest neighbors, k-means clustering, and L2 normalization [2].
What Euclidean Distance Means
In plain terms, Euclidean distance answers the question "how far apart are these two things?" when you can draw a straight line between them. On a map, it is the distance a bird would fly between two locations, ignoring roads and obstacles.
The precise definition is the length of the line segment between two points in Euclidean space. For points in $n$-dimensional space, you take the difference along each dimension, square each difference, add the squares, and take the square root. This is the $n$-dimensional form of the Pythagorean theorem [1].
The name comes from Euclid, the ancient Greek mathematician whose geometry describes flat space. The same idea scales from one dimension to any number of dimensions, which is why it works for data with many features.
How It Works
The formula for two points $A$ and $B$ with $n$ features each is:
$$d(A, B) = \sqrt{\sum_{i=1}^{n}(a_i - b_i)^2}$$
Each symbol means the following:
- $A$ and $B$ are the two points or observations you are comparing.
- $a_i$ is the value of feature $i$ for point $A$.
- $b_i$ is the value of feature $i$ for point $B$.
- $n$ is the number of features or dimensions.
- $(a_i - b_i)$ is the difference along one dimension.
- The squaring removes negative signs and gives more weight to large gaps.
- The square root returns the result to the original units.
In one dimension, the formula collapses to $|a_1 - b_1|$, the simple arithmetic difference between two values [1]. In two dimensions it is the Pythagorean theorem you learned in school. In three or more dimensions the same pattern continues, with one squared difference added for each feature [1].
Because the result is a distance, it is always zero or positive. Two identical points have a distance of zero, and any difference produces a positive value [2].
Worked Example
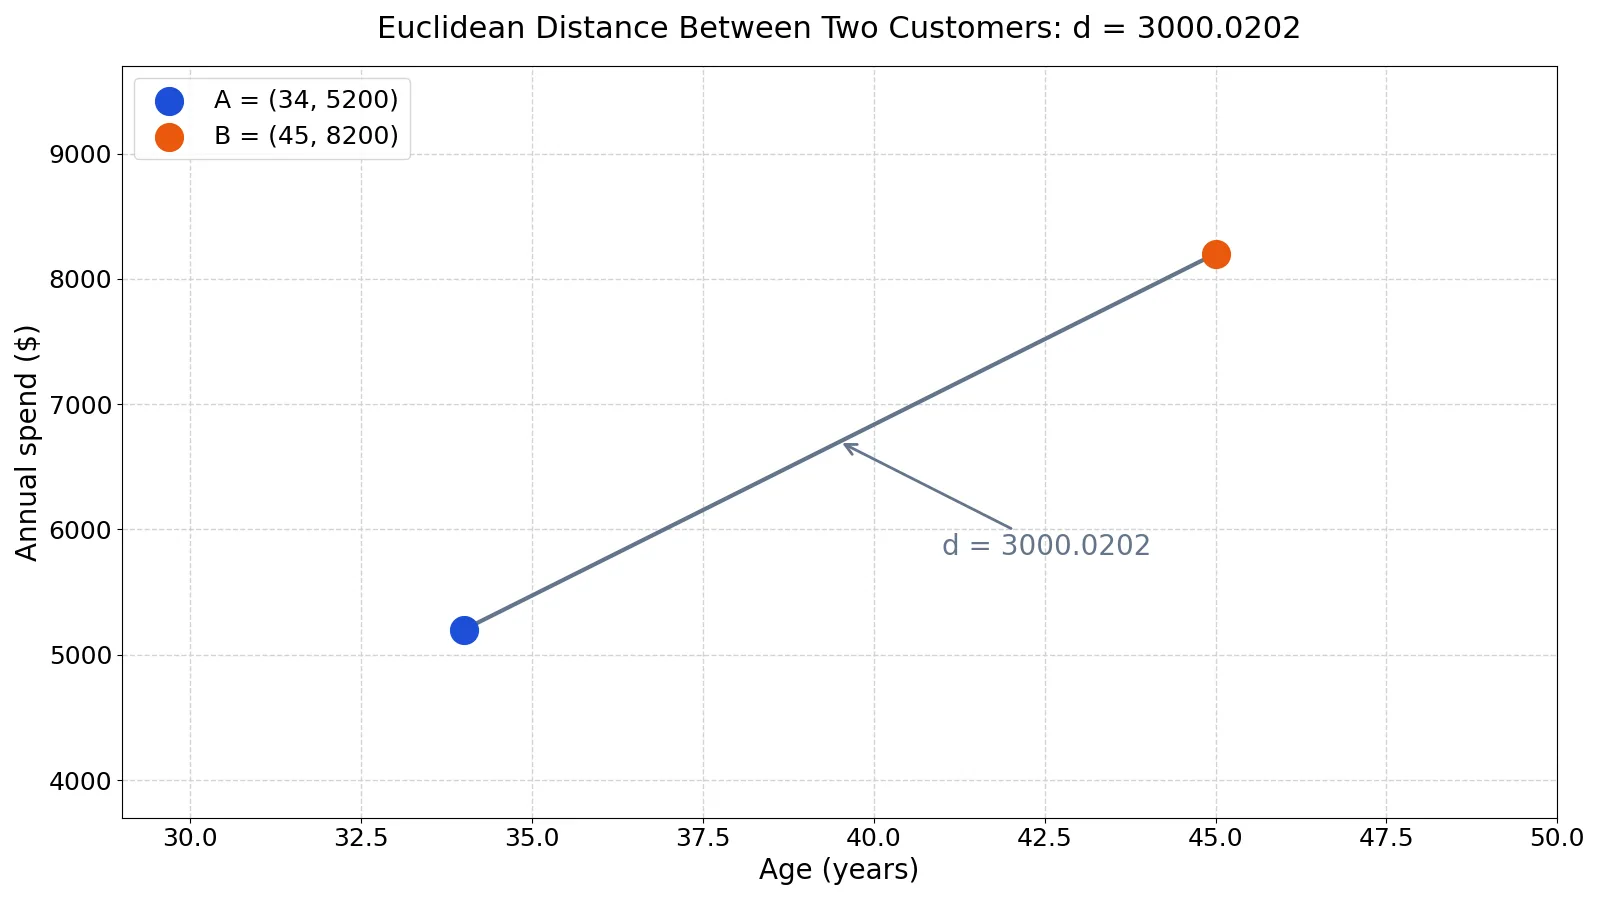
Suppose you have two customers described by two features: age in years and annual spend in USD. You want the Euclidean distance between customer C001 and customer C006.
| Customer | Age | Annual spend (USD) |
|---|---|---|
| C001 | 34 | 5200 |
| C006 | 45 | 8200 |
Point A is (34, 5200) and point B is (45, 8200). Here are the steps.
| Step | Value |
|---|---|
| Difference vector (B - A) | (11, 3000) |
| Squared differences | (121, 9000000) |
| Sum of squared differences | 121 + 9000000 = 9000121 |
| Euclidean distance = sqrt(sum of squares) | sqrt(9000121) = 3000.0202 |
The distance is 3000.0202. Notice that the spend feature dominates the result. The age gap of 11 years contributes only 121 to the sum of squares, while the spend gap of 3000 dollars contributes 9,000,000. This is a common pattern when features are measured on very different scales.
You can confirm the result in Python with scipy:
import numpy as np
from scipy.spatial.distance import euclidean

A = np.array([34, 5200])   # customer C001: age, spend
B = np.array([45, 8200])   # customer C006: age, spend
d = euclidean(A, B)
print(round(d, 4))  # 3000.0202
Output:
3000.0202The same value comes out of an Excel array formula. With C001 in row 2 and C006 in row 3 (age in column B, spend in column C), =SQRT(SUMSQ(B3:C3-B2:C2)) returns 3000.0202. Three tools, one answer.
How to Interpret It
Euclidean distance is a magnitude, not a score. A distance of 3000.0202 tells you how far apart the two customers sit in the two-dimensional feature space, but it does not tell you whether that is "close" or "far" in any absolute sense. That judgment depends on the scale of your data and the problem you are solving.
The units matter. In the example above, the distance is expressed in a mix of years and dollars, which is not a meaningful physical unit. The number is still useful for ranking pairs of points against each other, which is what most algorithms actually need.
Distance is monotonic with similarity in the opposite direction. Smaller distances mean more similar points, and larger distances mean less similar points [2]. If you need a similarity score instead, a metric like cosine similarity is often a better fit for text and high-dimensional data.
When to Use It (and when not to)
Use Euclidean distance when your features are continuous, measured on comparable scales, and the straight-line gap is a sensible notion of difference. It is a natural choice for physical measurements like coordinates, sensor readings, and image pixel values. It is the default in k-nearest neighbors, k-means clustering, and many anomaly detection methods.
Avoid it, or preprocess first, in these situations:
- Features have wildly different units or ranges. Standardize or normalize them first, or the largest-scale feature will dominate.
- Your data is high-dimensional and sparse, such as bag-of-words text. Distances concentrate and become less informative, and cosine distance usually works better.
- Your features are categorical. Euclidean distance assumes numeric values with meaningful arithmetic.
- You care about correlation or direction instead of magnitude.
If your data is skewed or has extreme outliers, check the distribution first. A quick look at histogram shapes will tell you whether a transformation is needed before you compute distances.
Euclidean Distance vs Manhattan Distance
The closest related idea is Manhattan distance, also called city-block or L1 distance. It sums the absolute differences instead of the squares of the differences.
| Property | Euclidean (L2) | Manhattan (L1) | ||
|---|---|---|---|---|
| Formula | $\sqrt{\sum (a_i - b_i)^2}$ | $\sum | a_i - b_i | $ |
| Path | Straight line | Grid-like path | ||
| Outlier sensitivity | Higher, because of squaring | Lower | ||
| Typical use | Continuous, low-dimensional data | High-dimensional or sparse data |
Euclidean distance punishes large single-feature gaps more heavily because each difference is squared. Manhattan distance treats every unit of difference equally. When your data has outliers or many dimensions, Manhattan distance is often the safer choice.
Common Mistakes
- Forgetting to scale features. A feature measured in thousands will drown out a feature measured in single digits. Fix it by standardizing or normalizing all features before computing distances.
- Comparing raw distances across different feature sets. A distance of 5 in one dataset is not comparable to a distance of 5 in another. Fix it by comparing distances only within the same feature space.
- Treating distance as a probability or a similarity score. Distance is not bounded above and does not sum to one. Fix it by converting to similarity only when the metric supports it.
- Using Euclidean distance on categorical or text data. The arithmetic is meaningless for unordered categories. Fix it by encoding categories properly or switching to a metric built for that data type.
- Ignoring the curse of dimensionality. In many dimensions, all points become roughly equidistant. Fix it by reducing dimensions or choosing a different metric.
- Assuming the result is in a meaningful unit. Mixed-unit features produce a number with no physical interpretation. Fix it by scaling features so the distance is unitless.
Limitations
Euclidean distance assumes that all features contribute equally and independently, and that the straight-line path is the right notion of difference. Neither assumption holds for every dataset. Correlated features effectively get counted twice, which inflates their influence on the result. You can check for this with a covariance calculation or by looking for multicollinearity before you rely on the distances.
The metric also degrades in high dimensions. As the number of features grows, the ratio between the largest and smallest pairwise distances shrinks toward one, so nearest neighbors stop being meaningfully nearer than distant points. This is a real problem for text and genomics data. In those settings, cosine distance or a learned metric is usually a better choice.
Frequently Asked Questions
What is the Euclidean distance formula?
For two points $A$ and $B$ with $n$ features, the formula is $d(A, B) = \sqrt{\sum_{i=1}^{n}(a_i - b_i)^2}$. You subtract each pair of feature values, square the differences, add them, and take the square root. In one dimension it simplifies to the absolute difference between the two values [1].
Is Euclidean distance the same as L2 distance?
Yes. L2 distance and Euclidean distance refer to the same measure. The "L2" label comes from the general family of $L_p$ norms, where $p = 2$ gives the Euclidean norm. Scikit-learn and other libraries use both names for the same computation [2].
Why does Euclidean distance give so much weight to one feature?
Because each difference is squared before summing. A feature with a large numeric range produces large squared differences that dominate the total. The fix is to standardize or normalize your features so they are on comparable scales before computing distances.
Can Euclidean distance be negative?
No. Squaring removes negative signs, and the square root of a non-negative number is non-negative. The distance is zero only when the two points are identical, and positive otherwise [2].
When should I use Euclidean distance instead of cosine similarity?
Use Euclidean distance when magnitude matters, such as comparing physical measurements or coordinates. Use cosine similarity when direction matters more than magnitude, such as comparing documents by their word-frequency vectors. Cosine similarity ignores vector length, which makes it more stable for high-dimensional text data [2].
References
- 'n'-Dimensional Euclidean Distance
- 8.8. Pairwise metrics, Affinities and Kernels, scikit-learn 1.9.1 documentation
Further Reading
- Lever J, Krzywinski M, Altman N (2016). Classification evaluation. Nature Methods
- scikit-learn User Guide
- Wilson G, Bryan J, Cranston K et al. (2017). Good enough practices in scientific computing. PLOS Computational Biology
- Lever J, Krzywinski M, Altman N (2016). Model selection and overfitting. Nature Methods