Cosine Similarity and Cosine Distance: Formula and Examples
By Dr. Zubair Khalid, DVM, MS, PhD ·
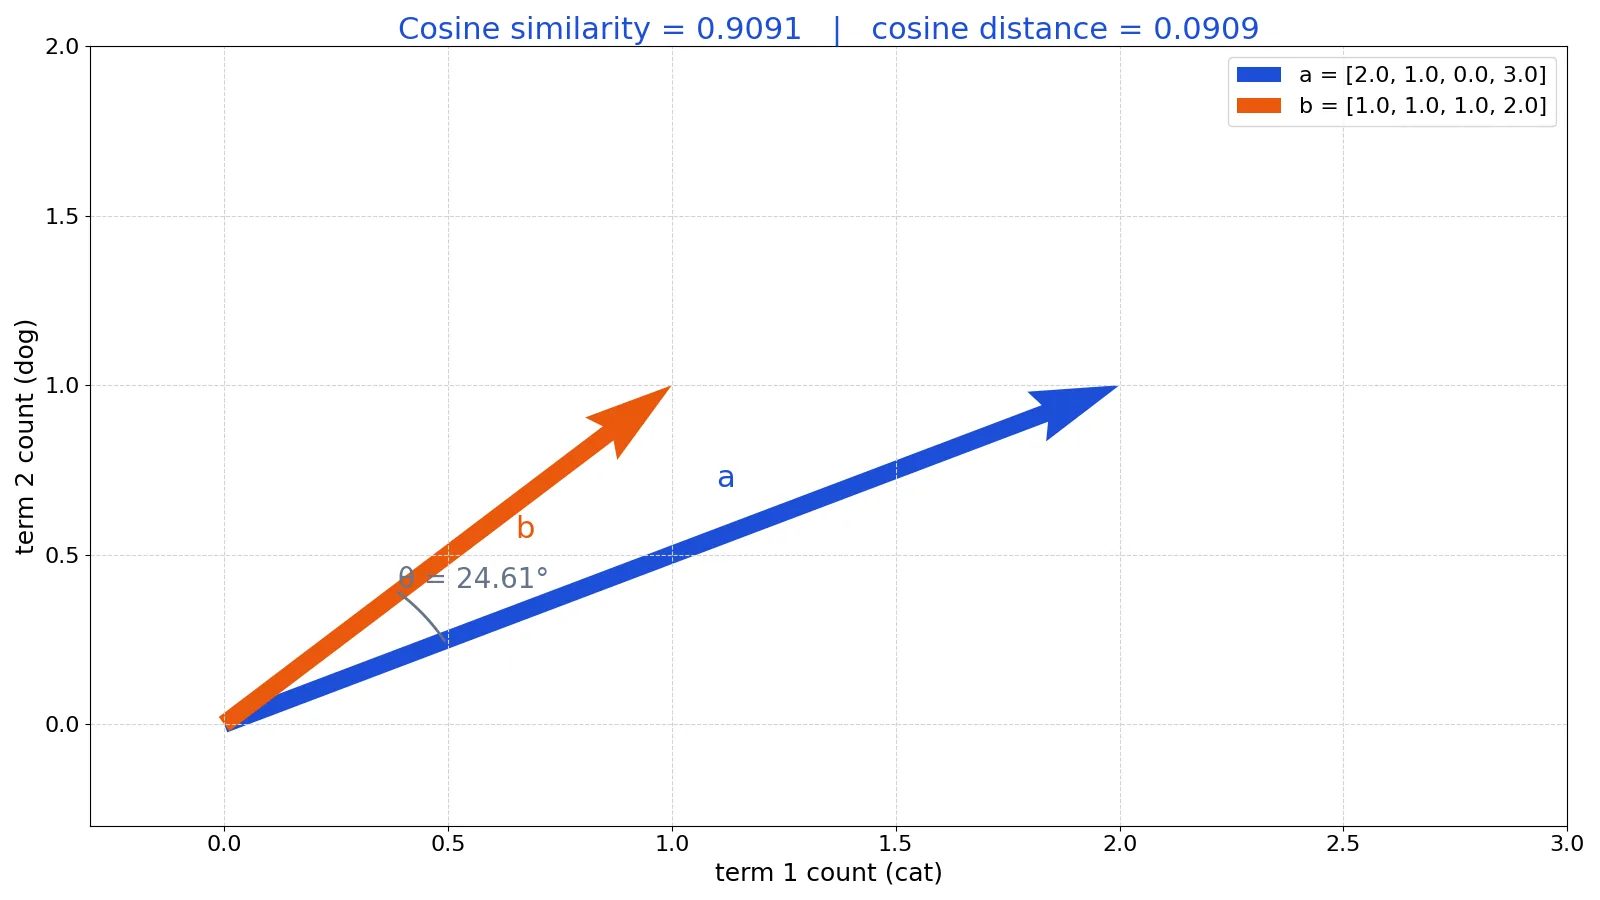
Cosine correlation is the idea that two vectors can be compared by the angle between them instead of by the distance between their endpoints. The cosine of that angle gives a similarity score from -1 to 1, and subtracting it from 1 gives the cosine distance. This article shows the formula, a full worked example, and where the measure helps or misleads.
Quick Answer
- Cosine similarity is the dot product of two vectors divided by the product of their lengths: $\cos(\theta) = \frac{a \cdot b}{\|a\| \, \|b\|}$.
- It measures the cosine of the angle between the vectors, so it captures orientation, not magnitude [1].
- Cosine distance is simply $1 - \text{cosine similarity}$, so a similarity of 0.9091 becomes a distance of 0.0909.
- Values run from -1 (opposite directions) through 0 (perpendicular) to 1 (identical direction).
- It is the standard similarity measure for text vectors, where document length should not dominate the comparison.
What Cosine Correlation Means
In plain terms, cosine correlation asks how closely two vectors point in the same direction. If you draw both vectors from the same origin, the angle between them tells you how alike they are. A small angle means high similarity, a right angle means no shared direction, and an angle near 180 degrees means they point opposite ways.
The precise statistical definition: cosine similarity is a measure of similarity between two vectors of an inner product space that measures the cosine of the angle between them [1]. That definition applies to any pair of numeric vectors of the same length, whether they hold word counts, ratings, sensor readings, or embedding coordinates.
The name "cosine correlation" is common in text mining and machine learning, but it is not a correlation coefficient in the Pearson sense. Pearson correlation centers each vector by subtracting its mean before comparing. Cosine similarity does not center anything. The two coincide only when both vectors have a mean of zero.
How It Works
The formula has three parts: a dot product on top and two vector lengths on the bottom.
$$\cos(\theta) = \frac{a \cdot b}{\|a\| \, \|b\|} = \frac{\sum_{i=1}^{n} a_i b_i}{\sqrt{\sum_{i=1}^{n} a_i^2} \sqrt{\sum_{i=1}^{n} b_i^2}}$$
Each symbol means the following.
| Symbol | Meaning | ||
|---|---|---|---|
| $a$, $b$ | The two vectors being compared, each with $n$ components | ||
| $a_i$, $b_i$ | The $i$-th component of each vector | ||
| $a \cdot b$ | Dot product, the sum of the component-wise products | ||
| $\ | a\ | $ | Euclidean norm of $a$, the square root of the sum of its squared components |
| $\theta$ | The angle between the two vectors | ||
| $\cos(\theta)$ | Cosine similarity, bounded between -1 and 1 |
Cosine distance is the complement:
$$d_{\cos}(a, b) = 1 - \cos(\theta)$$
Because similarity sits between -1 and 1, distance sits between 0 and 2. Identical direction gives distance 0, perpendicular gives distance 1, and opposite direction gives distance 2. The distance is not a true metric in every setting, but it behaves well enough for ranking and clustering.
The key property is scale invariance. If you multiply every component of $a$ by 10, the dot product and the norm both scale by 10, so the ratio is unchanged. That is why a long document and a short document on the same topic can still score high.
Worked Example
The dataset holds word counts for two short documents across four terms.
| document | cat | dog | fish | bird |
|---|---|---|---|---|
| doc_a | 2 | 1 | 0 | 3 |
| doc_b | 1 | 1 | 1 | 2 |
Treat each row as a vector over the four terms.
Step 1. Write the vectors.
$$a = [2.0, 1.0, 0.0, 3.0], \quad b = [1.0, 1.0, 1.0, 2.0]$$
Step 2. Compute the dot product.
$$a \cdot b = 2 \cdot 1 + 1 \cdot 1 + 0 \cdot 1 + 3 \cdot 2 = 9$$
Step 3. Compute the norms.
$$\|a\| = \sqrt{2^2 + 1^2 + 0^2 + 3^2} = 3.7417$$
$$\|b\| = \sqrt{1^2 + 1^2 + 1^2 + 2^2} = 2.6458$$
Step 4. Divide.
$$\cos(\theta) = \frac{9}{3.7417 \times 2.6458} = 0.9091$$
Step 5. Convert to distance and to an angle.
$$d_{\cos} = 1 - 0.9091 = 0.0909$$
$$\theta = \arccos(0.9091) = 0.4296 \text{ rad} = 24.61^\circ$$
The two documents point in nearly the same direction, about 25 degrees apart. The Python version is short.
import numpy as np
a = np.array([2, 1, 0, 3])
b = np.array([1, 1, 1, 2])
cos_sim = np.dot(a, b) / (np.linalg.norm(a) * np.linalg.norm(b))
cos_dist = 1 - cos_sim
print(cos_sim, cos_dist)
Output:
0.9091372900969896 0.09086270990301037Rounded, the similarity is 0.9091 and the distance is 0.0909. If you want to check the arithmetic on your own numbers, the Correlation Coefficient Calculator handles the related Pearson computation.
How to Interpret It
Read the similarity as a direction score, not a magnitude score.
| Similarity | Angle | Distance | Reading |
|---|---|---|---|
| 1.0 | 0° | 0.0 | Same direction, proportional vectors |
| 0.8 to 1.0 | 0° to 37° | 0.0 to 0.2 | Very similar orientation |
| 0.5 | 60° | 0.5 | Moderately similar |
| 0.0 | 90° | 1.0 | No shared direction |
| -1.0 | 180° | 2.0 | Opposite directions |
For text data, values above roughly 0.7 usually indicate documents about the same topic, though the right cutoff depends on your corpus and vectorization. For embeddings, the useful range is often narrower because most pairs sit between 0.0 and 0.5. Always calibrate against a sample of known pairs instead of trusting a fixed threshold.
One caution: a similarity of 0.9091 does not mean "91 percent the same." It means the angle is 24.61 degrees. Similarity and percentage overlap are different quantities.
When to Use It (and when not to)
Use cosine similarity when direction matters more than size. The classic case is text. A 500-word article and a 50-word note about the same subject should score as similar, and cosine similarity delivers that because it ignores vector length. It also works well for high-dimensional sparse data, where Euclidean distance tends to concentrate and lose contrast. If you need a distance for clustering or nearest neighbors, the Euclidean distance formula is the more familiar alternative, and comparing the two on your data is a quick sanity check.
Avoid it when magnitude carries real meaning. If two vectors represent sales totals across regions, a store with double the sales in every region has the same cosine similarity to a baseline as a store with identical sales. That is usually wrong for the question you are asking. In those cases, use a distance that respects scale, or normalize the data first if you genuinely want a shape comparison.
Also avoid it when vectors can be all zeros. The denominator becomes zero and the similarity is undefined. Guard against that in code.
Cosine Similarity vs Pearson Correlation
These two are easy to confuse because both produce values between -1 and 1 and both are called "correlation" in casual use. The difference is mean centering.
| Feature | Cosine similarity | Pearson correlation |
|---|---|---|
| Mean centering | None | Subtracts the mean of each vector |
| Measures | Angle from the origin | Angle after centering |
| Sensitive to shifts | Yes, adding a constant changes the score | No, adding a constant leaves it unchanged |
| Typical use | Text vectors, embeddings, sparse counts | Linear association between variables |
| Range | -1 to 1 | -1 to 1 |
If your vectors are already centered, the two give identical results. If they are raw counts, they can diverge sharply. For the centered case, see correlation vs covariance for how the mean-centered family fits together.
Common Mistakes
- Calling it a percentage. A similarity of 0.9091 is not 90.91 percent overlap. Fix: report it as a cosine value or convert it to an angle in degrees.
- Forgetting to handle zero vectors. An all-zero vector makes the denominator zero. Fix: check the norm before dividing and return 0 or skip the pair.
- Using raw counts when magnitude matters. Cosine similarity ignores length, so a big and a small vector can score 1.0. Fix: use a scale-aware distance or normalize deliberately.
- Confusing it with Pearson correlation. They differ whenever the vectors are not mean-centered. Fix: decide whether you want to remove the mean, then pick the matching formula.
- Comparing scores across different vectorizations. A TF-IDF score and a raw count score are not on the same scale. Fix: keep one vectorization method within a single comparison.
- Treating cosine distance as a metric without checking. It does not satisfy the triangle inequality in all cases. Fix: verify the property your algorithm needs before relying on it.
Limitations
Cosine similarity ignores magnitude entirely, which is a feature for text and a bug for anything where size is part of the signal. Two vectors can score 1.0 while having wildly different totals. It also says nothing about statistical significance. A high score between two short vectors can be noise, and there is no p-value attached to the number.
The measure is also sensitive to how you build the vectors. Adding a constant to every component shifts the angle and changes the score, so preprocessing choices like smoothing or log transforms matter. In very high dimensions, most pairs of random vectors cluster near a similarity of 0, which compresses the useful range and makes thresholds hard to set. Finally, the score is symmetric, so it cannot express one-directional relationships the way an asymmetric measure can.
Frequently Asked Questions
Is cosine similarity the same as cosine correlation?
In practice, yes. "Cosine correlation" is a common informal name for cosine similarity, especially in text mining. Strictly, the term correlation usually implies mean centering, which cosine similarity does not do. If your vectors are mean-centered, the two are numerically identical.
What is the difference between cosine similarity and cosine distance?
Cosine distance is one minus cosine similarity. Similarity runs from -1 to 1, so distance runs from 0 to 2. Use similarity when you want a high number to mean "alike" and distance when you want a low number to mean "alike," which is what most clustering and nearest-neighbor algorithms expect.
Can cosine similarity be negative?
Yes. A negative value means the vectors point in generally opposite directions, with an angle greater than 90 degrees. This happens with centered data or embeddings that include negative components. Raw word counts are non-negative, so their cosine similarity is always between 0 and 1.
Why does cosine similarity ignore vector length?
Because both the dot product and the norms scale linearly with the vector, so the ratio cancels the length out. That is exactly what you want when comparing documents of different sizes, and exactly what you do not want when total volume is meaningful.
How do I compute cosine similarity in Python?
Use NumPy: divide the dot product by the product of the two norms, as in the worked example above. For a full matrix of pairs, scikit-learn's cosine_similarity function returns all pairwise scores at once. Both approaches give the same value for a single pair.
References
Further Reading
- scipy.stats.cosine, SciPy v1.18.0 Manual
- NIST/SEMATECH e-Handbook of Statistical Methods
- OpenStax. Introductory Statistics 2e
- Krzywinski M, Altman N (2013). Importance of being uncertain. Nature Methods
- Krzywinski M, Altman N (2013). Significance, P values and t-tests. Nature Methods
Related Articles
- Euclidean Distance: Definition, Formula and Examples
- Correlation vs Covariance: Differences and When to Use Each
- Correlation Examples: Positive, Negative and Zero Relationships
- Covariance Formula: Definition and Calculation Examples
- Excel CORREL Function: Formula, Syntax and Examples
- Statistical Symbols and Notation: A Quick Reference
- Phonetic Transcription: A Guide to Sound Notation
- Which R-Value Represents the Strongest Correlation? A Guide to Interpreting Correlation Coefficients