What Is Slope? Definition, Formula and Regression Examples
By Dr. Zubair Khalid, DVM, MS, PhD ·
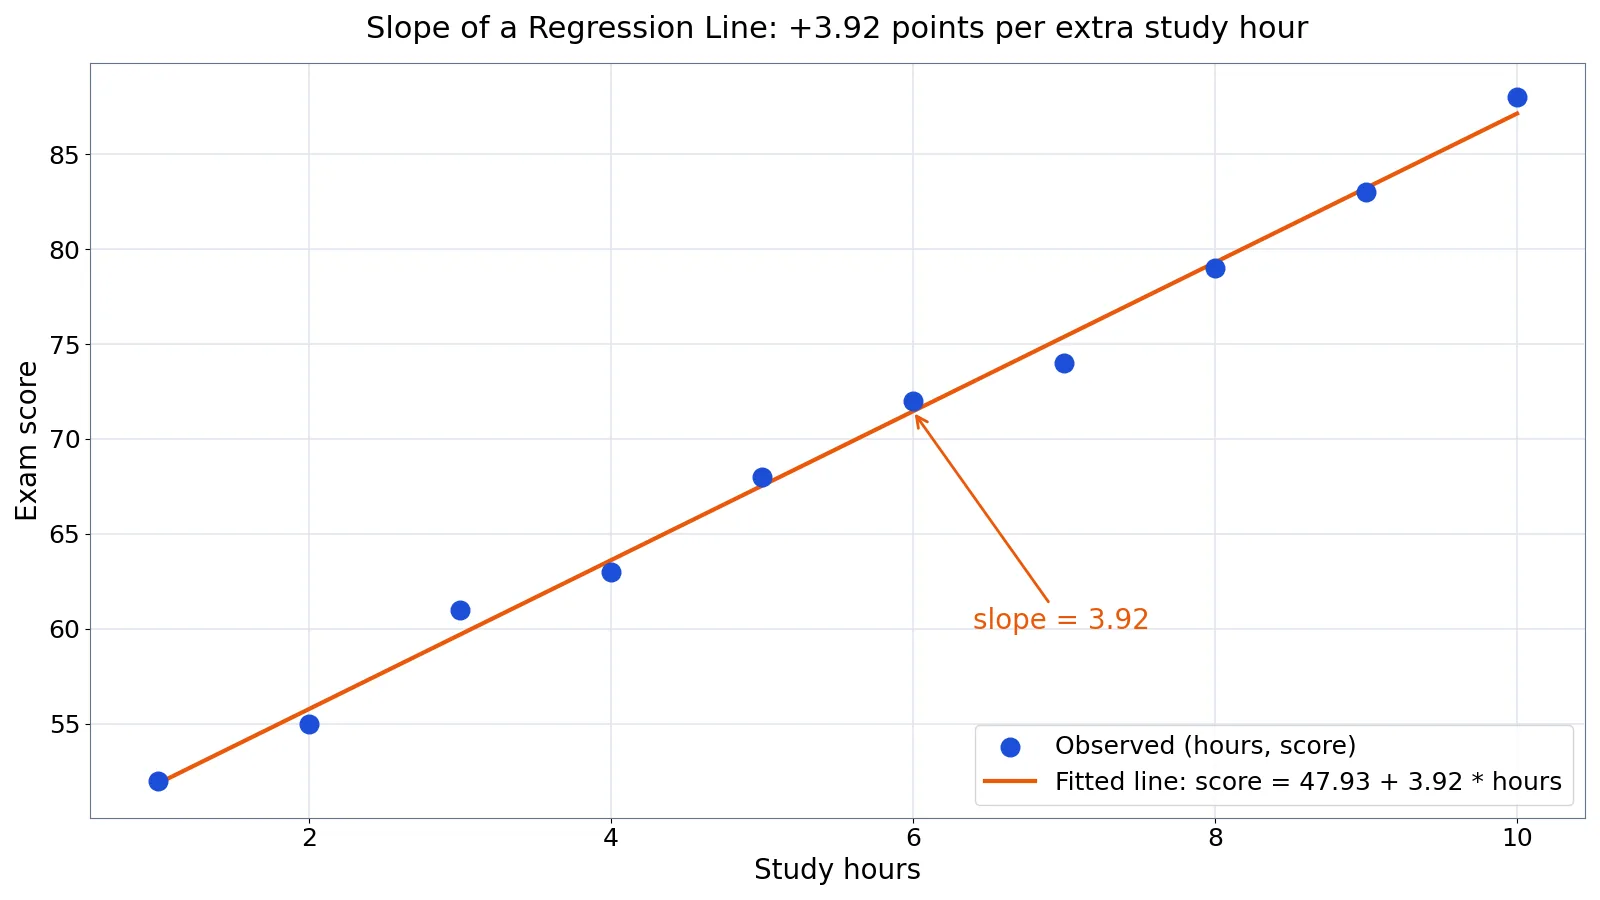
What is slope? Slope is the number that tells you how steep a line is and in which direction it moves. In a regression line, slope is the change in the predicted outcome for a one-unit increase in the predictor. This article defines slope, gives the formula, and walks through a full regression example with real numbers.
Quick Answer
- Slope is the ratio of vertical change to horizontal change between two points on a line, often written as "rise over run" [1].
- The formula for a straight line is $m = \dfrac{y_2 - y_1}{x_2 - x_1}$, where the numerator is the change in $y$ and the denominator is the change in $x$ [1].
- A positive slope means $y$ rises as $x$ rises. A negative slope means $y$ falls as $x$ rises. A slope of zero means the line is flat.
- In simple linear regression, the slope is $b_1 = \dfrac{S_{xy}}{S_{xx}}$, the covariance-style sum divided by the sum of squared deviations in $x$.
- Slope is a rate, so it always carries units: points per hour, dollars per year, degrees per meter.
What Slope Means
In plain language, slope is how much one quantity changes when another quantity changes by one unit. If you walk up a hill, slope tells you how many meters you climb for every meter you move forward. If you track a budget, slope tells you how many dollars you spend for every extra day.
The precise statistical definition is the same idea made formal. Slope measures the inclination of a line or curve with respect to another line or curve [1]. For a straight line in the $xy$-plane that makes an angle $\theta$ with the $x$-axis, the slope equals the tangent of that angle, and it also equals the ratio of the changes in the two coordinates over some distance [1]. That ratio is what most people mean when they ask what is slope.
Two properties follow from the definition. First, slope is unit-dependent. Change the units of $x$ or $y$ and the slope changes, even though the relationship does not. Second, slope is a local property for curves. A curve can have a different slope at every point, which is why calculus defines the derivative as the slope of the tangent line.
How It Works
For two points $(x_1, y_1)$ and $(x_2, y_2)$ on a straight line, the slope is:
$$m = \frac{y_2 - y_1}{x_2 - x_1} = \frac{\Delta y}{\Delta x}$$
Each symbol has a job:
- $\Delta y$ is the vertical change, also called the rise.
- $\Delta x$ is the horizontal change, also called the run.
- $m$ is the slope, the constant rate of change along the line.
The slope-intercept form of a line is $y = mx + b$, where $m$ is the slope and $b$ is the $y$-intercept, the value of $y$ when $x = 0$.
Regression uses a slightly different formula because real data do not fall on a perfect line. The least-squares slope for a simple linear regression is:
$$b_1 = \frac{S_{xy}}{S_{xx}} = \frac{\sum (x_i - \bar{x})(y_i - \bar{y})}{\sum (x_i - \bar{x})^2}$$
Here $x_i$ and $y_i$ are the observed pairs, $\bar{x}$ and $\bar{y}$ are the sample means, $S_{xy}$ is the sum of the cross-products of the deviations, and $S_{xx}$ is the sum of squared deviations in $x$. The intercept is then $b_0 = \bar{y} - b_1\bar{x}$, which forces the fitted line through the point $(\bar{x}, \bar{y})$.
If you want to see how a slope is found by trial and error instead of by formula, the process is described in what gradient descent does.
Worked Example
The dataset below contains weekly study hours and exam scores for ten students. Hours is the predictor $x$ and score is the outcome $y$.
| Student | Hours ($x$) | Score ($y$) |
|---|---|---|
| 1 | 1 | 52 |
| 2 | 2 | 55 |
| 3 | 3 | 61 |
| 4 | 4 | 63 |
| 5 | 5 | 68 |
| 6 | 6 | 72 |
| 7 | 7 | 74 |
| 8 | 8 | 79 |
| 9 | 9 | 83 |
| 10 | 10 | 88 |
Step 1. Sample size: $n = 10$.
Step 2. Mean of $x$: $\bar{x} = 55/10 = 5.5000$.
Step 3. Mean of $y$: $\bar{y} = 695/10 = 69.5000$.
Step 4. Sum of squared deviations in $x$: $S_{xx} = 82.5000$.
Step 5. Sum of cross-products: $S_{xy} = 323.5000$.
Step 6. Slope: $b_1 = 323.5000 / 82.5000 = 3.9212$.
Step 7. Intercept: $b_0 = 69.5000 - 3.9212 \times 5.5000 = 47.9333$.
Step 8. Fit quality: $SSE = 5.9879$, $SST = 1274.5000$, so $R^2 = 0.9953$ and the correlation is $r = 0.9976$.
Step 9. Prediction at 6 hours: $47.9333 + 3.9212 \times 6 = 71.4606$ points.
The fitted line is $\hat{y} = 47.9333 + 3.9212x$. Here is the same calculation in Python and in Excel.
import numpy as np
hours = np.array([1,2,3,4,5,6,7,8,9,10])
scores = np.array([52,55,61,63,68,72,74,79,83,88])
slope, intercept = np.polyfit(hours, scores, 1)
print(round(slope, 4), round(intercept, 4))  # 3.9212 47.9333
Output:
3.9212 47.9333How to Interpret It
Read the slope as a sentence with units. In this example, the slope is 3.9212 points per hour, so each extra hour of study is associated with about 3.92 more points on the exam. The word "associated" matters. Regression slope describes a pattern in the data, not proof that one variable causes the other.
Three checks make an interpretation trustworthy.
First, check the sign against the story. A positive slope here fits the expectation that more study time goes with higher scores. A negative slope would need an explanation.
Second, check the size against the scale of $y$. A slope of 3.92 is large relative to the 36-point spread between the lowest and highest scores, so the effect is meaningful in this small sample.
Third, check the fit. With $R^2 = 0.9953$, the line explains almost all the variation in scores, so the slope is a good summary of these ten points. A low $R^2$ would mean the slope is real but weak, and individual predictions would be unreliable.
The intercept deserves a caution. Here $b_0 = 47.9333$ is the predicted score at zero hours of study, but no student in the data studied zero hours. That value is an extrapolation, and extrapolated intercepts are often meaningless. The slope is usually the safer number to report.
When to Use It (and when not to)
Use a regression slope when you have two numeric variables, you expect a roughly straight-line relationship, and you want a single number that summarizes the rate of change. It is the right tool for questions like "how much does each additional hour of study relate to exam score" or "how much does each extra year of experience relate to salary."
Do not use a linear slope when the relationship is clearly curved. A curve can rise, flatten, and fall, and one straight-line slope will average those behaviors into a misleading number. Do not use it when the predictor is categorical with no natural order, because "one unit more" has no meaning. Do not use it when outliers dominate the fit, since least squares gives every point weight and a single extreme value can pull the line far off course.
If your data are proportions or percentages, check how the values are scaled before you interpret the slope, since the units change the number. The same logic applies to any bounded measure, as explained in what a proportion is.
Slope vs Correlation
Slope and correlation both describe a linear relationship, and beginners often treat them as interchangeable. They are not.
| Property | Slope ($b_1$) | Correlation ($r$) |
|---|---|---|
| What it measures | Change in $y$ per one-unit change in $x$ | Strength and direction of the linear association |
| Units | Has units, such as points per hour | Unitless, always between -1 and 1 |
| Depends on scale | Yes, changing units changes the value | No, rescaling does not change it |
| Symmetry | Swapping $x$ and $y$ gives a different slope | Swapping $x$ and $y$ gives the same $r$ |
| Value in the example | 3.9212 | 0.9976 |
In the study-hours example, $r = 0.9976$ says the points sit almost exactly on a line. The slope of 3.9212 says how steep that line is. A different dataset could have the same $r$ with a much smaller or larger slope, depending on the units.
Common Mistakes
- Reading the slope as causation. A slope of 3.92 does not mean studying one more hour causes a 3.92-point gain. Fix: describe the relationship as an association unless you have a controlled design.
- Dropping the units. Saying "the slope is 3.92" hides the meaning. Fix: always write "3.92 points per hour" or whatever the units are.
- Confusing slope with intercept. The intercept is the predicted $y$ where the line crosses $x = 0$, not the rate of change. Fix: label each coefficient when you report results.
- Extrapolating beyond the data range. Predicting scores for 40 hours of study assumes the straight line continues, which the data cannot support. Fix: keep predictions inside the observed range of $x$.
- Ignoring outliers. One extreme point can change the slope substantially. Fix: plot the data and refit without suspect points to see how much the slope moves.
- Comparing slopes across different units. A slope in points per hour is not comparable to one in points per minute. Fix: standardize the variables or convert units before comparing.
Limitations
A regression slope summarizes only the linear part of a relationship. If the true pattern bends, the slope is an average rate that may describe no actual region of the data well. It also says nothing about causation, and it cannot tell you whether an omitted variable is driving both $x$ and $y$.
The slope is sensitive to the range of $x$ you observe. Restrict the data to a narrow band of study hours and the slope can change a lot, even with the same underlying process. Small samples make this worse, since a single unusual student can shift the line. Always report the slope with its units, the range of $x$, and a measure of fit such as $R^2$ so readers can judge how much weight it deserves.
Frequently Asked Questions
What is slope in simple terms?
Slope is how much a line goes up or down for each step to the right. If a line rises 4 units while moving 2 units right, the slope is 2. In regression, it is the predicted change in the outcome for a one-unit increase in the predictor.
What is the slope formula for two points?
Use $m = (y_2 - y_1) / (x_2 - x_1)$. Subtract the $y$-values to get the rise, subtract the $x$-values in the same order to get the run, then divide. The order of the points does not matter as long as you keep it consistent in both differences.
How do I interpret a negative slope?
A negative slope means $y$ tends to decrease as $x$ increases. For example, a slope of -2.5 dollars per day means the balance drops by about 2.5 dollars for each additional day. The magnitude tells you how fast the decline is, and the sign tells you the direction.
What does a slope of zero mean?
A slope of zero means the line is horizontal, so changes in $x$ come with no predicted change in $y$. In regression, this is the null result: the predictor carries no linear information about the outcome. Check the confidence interval before concluding the effect is truly zero.
How is regression slope different from the slope between two points?
The two-point slope uses exactly two observations and passes through both. The regression slope uses all the data and minimizes the sum of squared vertical distances, so it usually does not pass through any single point. With perfectly linear data, the two methods give the same number.
Can slope be greater than 1?
Yes. Slope has no upper or lower bound. A slope of 3.9212 in the study-hours example means each hour is linked to nearly 4 points. The size depends entirely on the units of $x$ and $y$, so a large slope is not automatically a strong effect.
For a quick visual check of whether a straight line fits your data, a line plot of the points before fitting will show curvature and outliers that a single slope number would hide. If you want to see how spread and slope interact, the formula for range shows how far the data extend, which sets the limits on safe interpretation.
References
Further Reading
- NIST/SEMATECH e-Handbook of Statistical Methods
- Altman N, Krzywinski M (2015). Simple linear regression. Nature Methods
- OpenStax. Introductory Statistics 2e
- Krzywinski M, Altman N (2013). Importance of being uncertain. Nature Methods
- Krzywinski M, Altman N (2013). Significance, P values and t-tests. Nature Methods